1.算法仿真效果
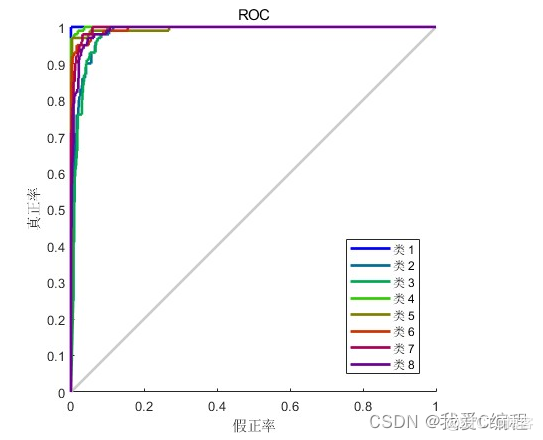
matlab2022a仿真结果如下:

2.算法涉及理论知识概要
根据卷积核大小和卷积层数,VGG共有6中配置,分别为A,A-LRN,B,C,D,E,其中D和E两种最为常用,即i我们所说的VGG16和VGG19。
具体为:
1. 卷积-卷积-池化-卷积-卷积-池化-卷积-卷积-卷积-池化-卷积-卷积-卷积-池化-卷积-卷积-卷积-池化-全连接-全连接-全连接 。
2. 通道数分别为64,128,512,512,512,4096,4096,1000。卷积层通道数翻倍,直到512时不再增加。通道数的增加,使更多的信息被提取出来。全连接的4096是经验值,当然也可以是别的数,但是不要小于最后的类别。1000表示要分类的类别数。
3. 所有的激活单元都是Relu 。
4. 用池化层作为分界,VGG16共有6个块结构,每个块结构中的通道数相同。因为卷积层和全连接层都有权重系数,也被称为权重层,其中卷积层13层,全连接3层,池化层不涉及权重。所以共有13+3=16权重层。
5. 对于VGG16卷积神经网络而言,其13层卷积层和5层池化层负责进行特征的提取,最后的3层全连接层负责完成分类任务。
vgg16总共有16层,13个卷积层和3个全连接层,第一次经过64个卷积核的两次卷积后,采用一次pooling,第二次经过两次128个卷积核卷积后,再采用pooling,再重复两次三个512个卷积核卷积后,再pooling,最后经过三次全连接。如下图所示:

VGG优点
VGGNet的结构非常简洁,整个网络都使用了同样大小的卷积核尺寸(3x3)和最大池化尺寸(2x2)。几个小滤波器(3x3)卷积层的组合比一个大滤波器(5x5或7x7)卷积层好:验证了通过不断加深网络结构可以提升性能。
VGG缺点
VGG耗费更多计算资源,并且使用了更多的参数(这里不是3x3卷积的锅),导致更多的内存占用(140M)。其中绝大多数的参数都是来自于第一个全连接层。VGG可是有3个全连接层啊!
3.MATLAB核心程序
train_P   = [];
train_T   = [];
test_P    = [];
test_T    = [];

for i=1:length(types)
    i
    types{i}
    trainingImages   = imageDatastore(['images/train/' types{i}],'IncludeSubfolders',true,'LabelSource','foldernames');
    testImages       = imageDatastore(['images/test/' types{i}],'IncludeSubfolders',true,'LabelSource','foldernames');
    augimdsTrain     = augmentedImageDatastore(inputSize(1:2),trainingImages);
    augimdsTest      = augmentedImageDatastore(inputSize(1:2),testImages);
    trainingFeatures = activations(net,augimdsTrain,'fc8','OutputAs','channels');
    testFeatures     = activations(net,augimdsTest,'fc8','OutputAs','channels');
    train_P          = [train_P;squeeze(trainingFeatures(1,1,:,:))'];
    train_T          = [train_T;trainingImages.Labels];
    test_P           = [test_P;squeeze(testFeatures(1,1,:,:))'];
    test_T           = [test_T;testImages.Labels];
end


nest                    = fitcecoc(train_P,train_T);
[predictedLabels scores]= predict(nest,test_P);
accuracy                = mean(predictedLabels == test_T);
targets                 = zeros(size(scores'));
for i=1:size(test_T,1)
    I               = find(types==test_T(i));
    targets(I(1),i) = 1;
end
cmat                = confusionmat(test_T,predictedLabels);
figure;
imagesc(cmat);
xlabel('Target Class');
ylabel('Predicted Class');
title(['VGG16 accuracy= ' num2str(100*accuracy),'%']);
colorbar
figure;
plotroc(targets,scores')