
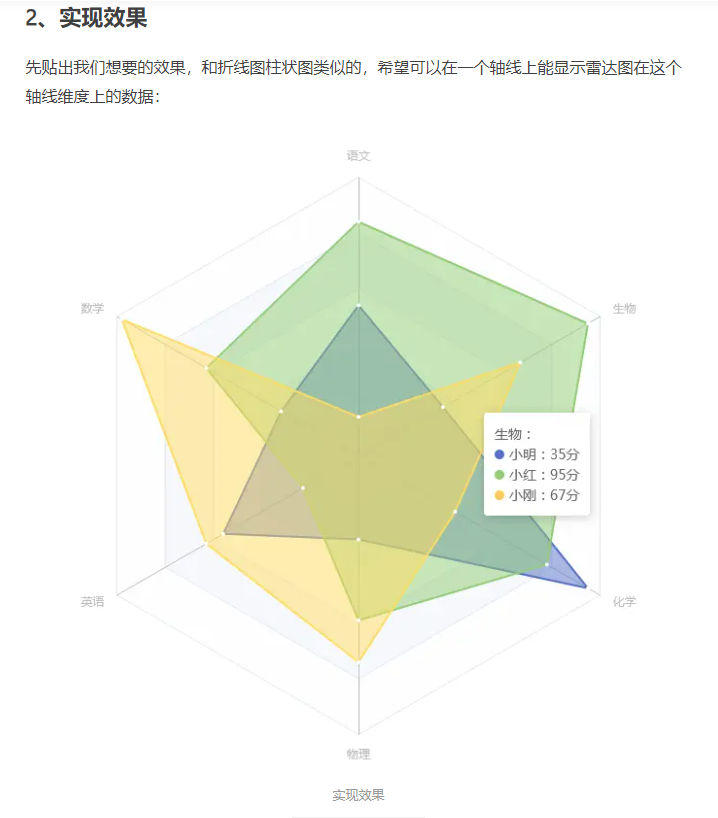

const dataList = [
    {
        name: '小明',
        data: [54, 32, 56, 30, 95, 35],
        color: '#5470c6',
        unit: '分'
    },
    {
        name: '小红',
        data: [84, 63, 23, 59, 78, 95],
        color: '#91cc75',
        unit: '分'
    },
    {
        name: '小刚',
        data: [14, 98, 63, 74, 40, 67],
        color: '#fac858',
        unit: '分'
    }
]

const indicator = [
    { name: '语文', max: 100 },
    { name: '数学', max: 100 },
    { name: '英语', max: 100 },
    { name: '物理', max: 100 },
    { name: '化学', max: 100 },
    { name: '生物', max: 100 }
]

const buildSeries = function (dataIndex) {
    const data = dataList[dataIndex].data
    const helper = data.map((item, index) => {
        const arr = new Array(data.length)
        arr.splice(index, 1, item)
        return arr
    })
    return [data, ...helper].map((item, index) => {
        return {
            name: dataList[dataIndex].name,
            type: 'radar',
            symbol: index === 0 ? 'circle' : 'none',
            symbolSize: 4,
            itemStyle: {
                color: '#fff'
            },
            lineStyle: {
                color: index === 0 ? dataList[dataIndex].color : 'transparent'
            },
            areaStyle: {
                color: index === 0 ? dataList[dataIndex].color : 'transparent',
                opacity: 0.5
            },
            tooltip: {
                show: index === 0 ? false : true,
                formatter: () => {
                    let res = indicator[index - 1].name + ':<br>'
                    for (let x of dataList) {
                        let str = '<i style="display: inline-block;width: 10px;height: 10px;background: ' +
                            x.color + ';margin-right: 5px;border-radius: 50%;}"></i>' +
                            x.name + ':' + x.data[index - 1] + x.unit + '<br>'
                        res += str
                    }
                    return res

                }
            },
            z: index === 0 ? 1 : 2,
            data: [item]
        }
    })
}

const series = []
for (let i in dataList) {
    series.push(...buildSeries(i))
}

option = {
    tooltip: {},
    radar: {
        indicator: indicator
    },
    series: series
}