

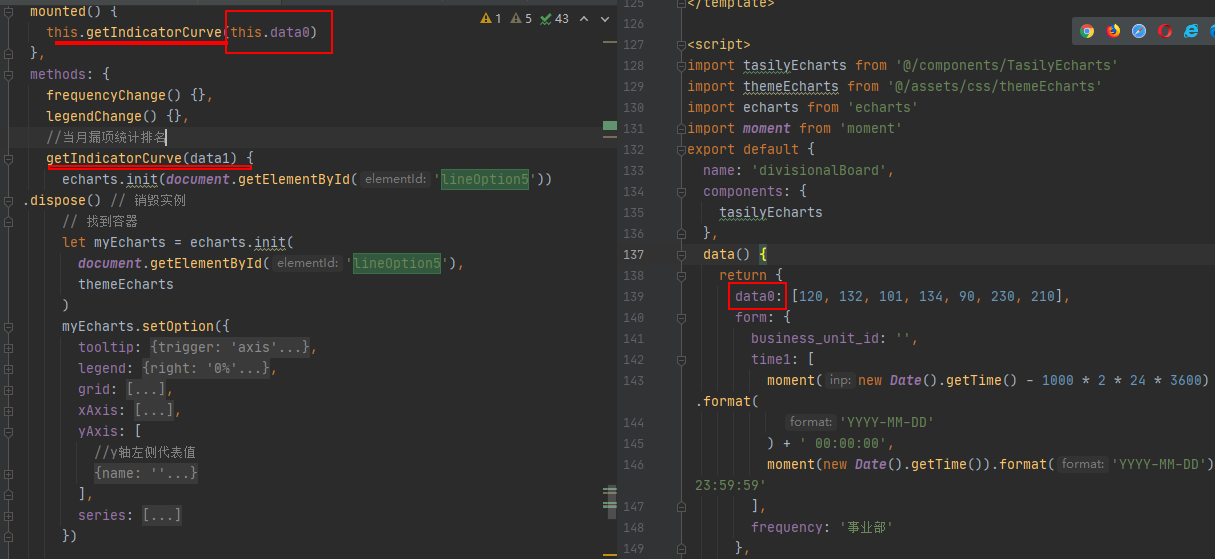

    //当月漏项统计排名
    getIndicatorCurve(data1) {
      echarts.init(document.getElementById('lineOption5')).dispose() // 销毁实例
      // 找到容器
      let myEcharts = echarts.init(
        document.getElementById('lineOption5'),
        themeEcharts
      )
      myEcharts.setOption({
        tooltip: {
          trigger: 'axis',
          axisPointer: {
            type: 'cross',
            label: { color: '#fff' },
            crossStyle: { color: '#6d7882' }
          }
          /*          formatter: function(datas) {
            console.log('datas', datas)
            let res = datas[0].name + '<br/>'
            for (let i = 0, length = datas.length; i < length; i++) {
              res += datas[i].seriesName + ':' + datas[i].data.value + '%<br/>'
            }
            return res
          }*/
        },
        legend: {
          right: '0%',
          top: '-1%',
          data: ['人工', '非人工'],
          textStyle: { fontSize: 12 },
          show: true,
          selectedMode: false
        },
        grid: [
          {
            show: true,
            top: '9%',
            left: '0%',
            right: '0%',
            bottom: '4%',
            containLabel: true
          }
        ],
        xAxis: [
          {
            type: 'category',
            axisLine: {
              lineStyle: {
                color: '#6d7882'
              }
            },
            splitLine: {
              show: true,
              lineStyle: { color: '#d4d7da' }
            },
            data: ['中板厂', '宽板厂', '板卷厂', '一炼钢', '金石', '金润']
          }
        ],
        yAxis: [
          //y轴左侧代表值
          {
            type: 'value',
            name: '',
            position: 'left',
            alignTicks: true,
            splitNumber: 5,
            // min: 0,
            // interval: Math.ceil(Math.ceil(Math.max(100)) / 5),
            // max: Math.ceil(Math.ceil(Math.max(100)) / 5) * 5,
            axisLine: {
              show: false
              /*   lineStyle: {
                color: '#d4d7da'
              }*/
            },
            splitLine: {
              show: true,
              lineStyle: { color: '#d4d7da' }
            },
            axisLabel: {
              formatter: '{value}'
            }
          }
        ],
        series: [
          /*{
            name: '当月漏项',
            type: 'bar',
            barGap: 0.2,
            barWidth: 22,
            data: [80, 75, 70, 65, 60, 50],
            color: '#FFB243'
          },*/
          {
            name: '人工',
            type: 'bar',
            barGap: 0.2,
            barWidth: 22,
            stack: 'Ad',
            color: '#FFB243',
            emphasis: {
              focus: 'series'
            },
            data: data1
          },
          {
            name: '非人工',
            type: 'bar',
            barGap: 0.2,
            barWidth: 22,
            stack: 'Ad',
            color: '#3391FF',
            emphasis: {
              focus: 'series'
            },
            label: {
              normal: {
                // 重写未完成label,通过计算属性重新给formatter赋值,返回
                show: true, // 计算的总数
                position: 'top',
                formatter: function(params) {
                  return params.value + data1[params.dataIndex]
                },
                textStyle: { color: '#000' }
              }
            },
            itemStyle: {
              normal: {
                color: '#3391FF'
              }
            },
            data: [220, 182, 191, 234, 290, 330, 310]
          }
        ]
      })

      myEcharts.resize()
    }