原文:http://wiki.lazarus.freepascal.org/BGRABitmap_tutorial_TAChart
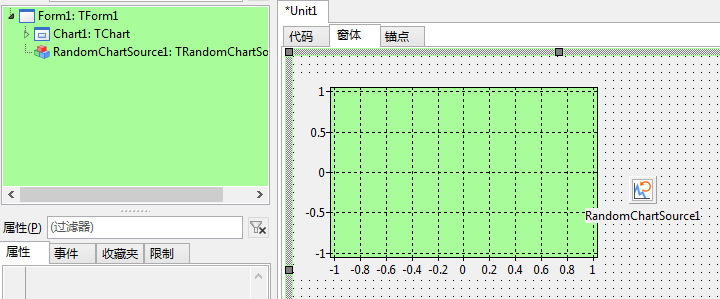
新建一个applicasion,向里面拖入一个Chart1,一个RandomChartSource1。
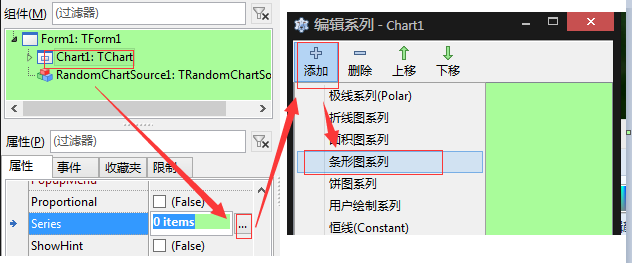
然后单击chart,点击Series 属性的‘...’
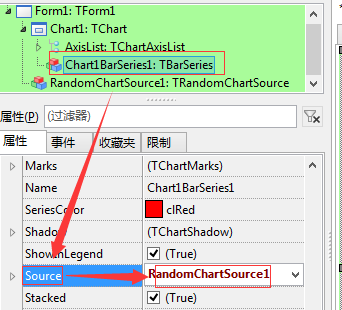
新建了一个Chart1.BarSeries1,点击它,设置它的Source 为RandomChartSource1
选中RandomChartSource1,设置:PointsNumber : 10, XMax : 10 and YMax : 10, 为了以3D显示,设置Depth为10或者其他数字。