文档中{普通文字}{%图片}{%%居中图片}
<template>
    <el-date-picker
            v-model="value"
            class="timePicker"
            type="day"
            placeholder=""
            format="YYYY-MM-DD "
            value-format="YYYY-MM-DD">
    </el-date-picker>
    <el-button type="primary" size="mini" @click="Export()">导出word</el-button>
</template>

<script>
    import exportWord from '@/utils/export-word'
    export default {
        name: "Chartgeneration",
        mixins:[exportWord],
        data() {
        },
        data: function() {
            return {
                value: ''
            }
        },
    methods:{
        Export:function () {
            const data = {
                monitoringLine:'长白线',
                measuringpointKilometerPost:'K268+260',
                measuringpointName:'43#基站',
                cableModel:'SPTYWPL23',
                cableLength:'3.5km',
                start: '2022',
                JSON: 'json',
                ex: 'docx.js, docx4j, python-docx'
            }
            this.exportWord(data)
        }
        }
}
</script>
export-word.js
import docxtemplater from 'docxtemplater'
import PizZip from 'pizzip'
import JSZipUtils from 'jszip-utils'
import { saveAs } from 'file-saver'
import * as echarts from 'echarts';
import ImageModule from 'docxtemplater-image-module-free'
export default {
    methods: {
        // 导出echarts图片,格式转换
        base64DataURLToArrayBuffer(dataURL) {
            const base64Regex = /^data:image\/(png|jpg|svg|svg\+xml);base64,/;
            if (!base64Regex.test(dataURL)) {
                return false;
            }
            const stringBase64 = dataURL.replace(base64Regex, "");
            let binaryString;
            if (typeof window !== "undefined") {
                binaryString = window.atob(stringBase64);
            } else {
                binaryString = new Buffer(stringBase64, "base64").toString("binary");
            }
            const len = binaryString.length;
            const bytes = new Uint8Array(len);
            for (let i = 0; i < len; i++) {
                const ascii = binaryString.charCodeAt(i);
                bytes[i] = ascii;
            }
            return bytes.buffer;
        },

        //echarts
        exportWord(
            data,
            docTitle = '题目'
        ) {
            const div = document.createElement('div');
            div.setAttribute('style', 'width: 560px;height:280px;')

            const myChart = echarts.init(div)
            myChart.setOption({
                title: {
                    text: '示例'
                },
                tooltip: {},
                legend: {
                    data: ['销量']
                },
                xAxis: {
                    data: ["衬衫", "羊毛衫", "雪纺衫", "裤子", "高跟鞋", "袜子"]
                },
                yAxis: {},
                series: [{
                    name: '销量',
                    type: 'bar',
                    data: [5, 20, 36, 10, 10, 20]
                }]
            })
            let _this=this
            setTimeout(() => { // 加setTimeout是为了让echarts渲染完成后生成图片
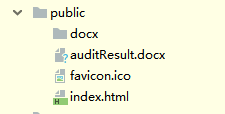
                JSZipUtils.getBinaryContent('/auditResult.docx', function (error, content) {
                    // 抛出异常
                    if (error) {
                        throw error
                    }
                    const opts = {
                        centered: false,
                        fileType: 'docx'
                    }
                    opts.getImage = function (tagValue) {
                        if (tagValue.size && tagValue.data) {
                            return _this.base64DataURLToArrayBuffer(tagValue.data);
                        }
                        return _this.base64DataURLToArrayBuffer(tagValue);
                    };
                    opts.getSize = function (_, tagValue) {
                        if (tagValue.size && tagValue.data) {
                            return tagValue.size;
                        }
                        return [560, 280];
                    };
                    // 创建一个JSZip实例,内容为模板的内容
                    const zip = new PizZip(content)
                    // 创建并加载docxtemplater实例对象
                    const doc = new docxtemplater().loadZip(zip)

                    doc.setOptions({
                        nullGetter: function () { //设置空值 undefined 为''
                            return '';
                        },
                    });
                    // 设置图片模块
                    doc.attachModule(new ImageModule(opts));

                    // 设置模板变量的值
                    doc.setData({
                        ...data,
                        image:myChart.getDataURL({
                            pixelRatio: 5, //导出的图片分辨率比率,默认是1
                            backgroundColor: '#fff', //图表背景色
                            excludeComponents: ['toolbox'], //忽略组件的列表
                            type: 'png', //图片类型支持png和jpeg
                        }),
                    })
                    try {
                        // 用模板变量的值替换所有模板变量
                        doc.render()
                    } catch (error) {
                        // 抛出异常
                        // const e = {
                        //   message: error.message,
                        //   name: error.name,
                        //   stack: error.stack,
                        //   properties: error.properties,
                        // }
                        console.error('导出报表失败')
                        throw error
                    }
                    // 生成一个代表docxtemplater对象的zip文件(不是一个真实的文件,而是在内存中的表示)
                    const out = doc.getZip().generate({
                        type: 'blob',
                        mimeType: 'application/vnd.openxmlformats-officedocument.wordprocessingml.document'
                    })
                    // 将目标文件对象保存为目标类型的文件,并命名
                    saveAs(out,`${docTitle}.doc`)
                })
            }, 1000);
        }
    }
}