一、选题的背景
为什么要选择此选题?要达到的数据分析目标是什么?从社会、经济、技术、数据来源等方面进行描述(200 字以内)(10 分)
最近Python大热,Python在数据分析、后端开发、人工智能、运维、全栈开发等多方面都具有得天独厚的优势。在一些行业爬虫工程师,人工智能,爬虫工程师,Python工程师,Python开发具有不可替代性。与其他语言相比,Python无论是在就业薪水方面,还是在市场岗位需求方面,都是当之无愧的黑马。并且上手较快,灵活性较高,许多行业都对此技术有较高的需求。
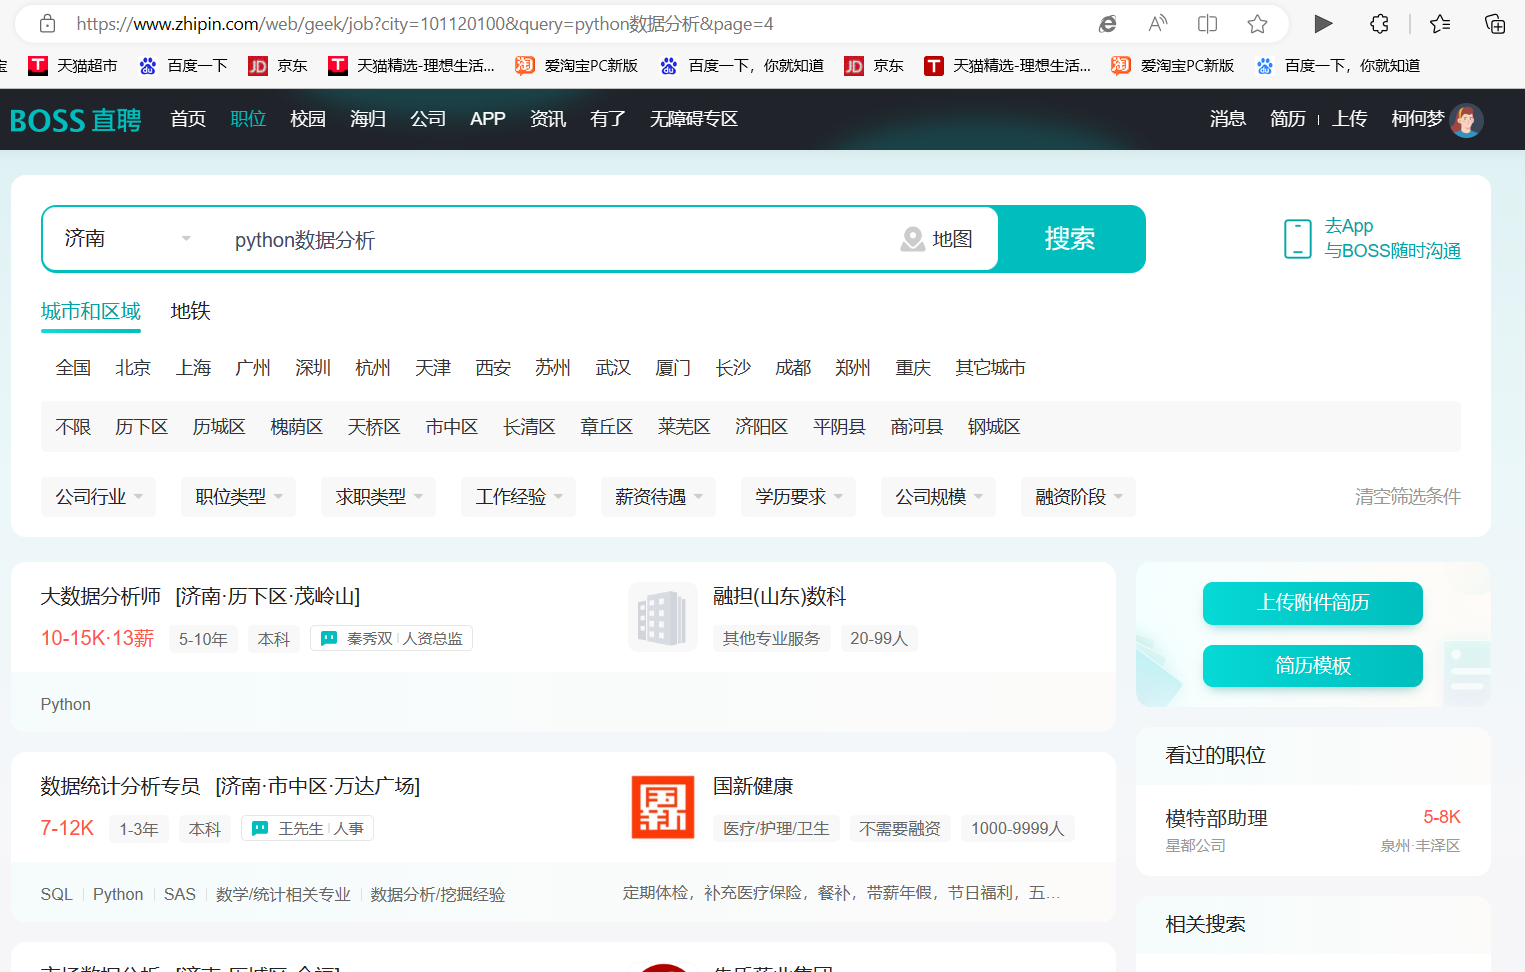
由此就想要分析一下相关的市场需求,看一下Python行业的就业方向,薪资和需求量,企业对Python工程师的一些需求到底是怎样的,基于此,爬取了国内某招聘平台的相关数据,获取到多条相关岗位数据,下面是一些数据的分析以及可视化。
二、数据内容及操作思路(10 分)
数据内容:将相关职位名称,公司名称,薪资,地区等数据提取并保存为khm.csv文件
操作思路:1.爬取网址内容
2.对数据进行清洗
3.获取所需数据并保存
4.利用可视化分析数据薪资,地区等因素的联系
三、数据分析步骤(70 分)
数据源
(一).将网址的所需的信息爬取,并保存在excel表格中,以下为爬取并保存为excel文档文件的代码
1.
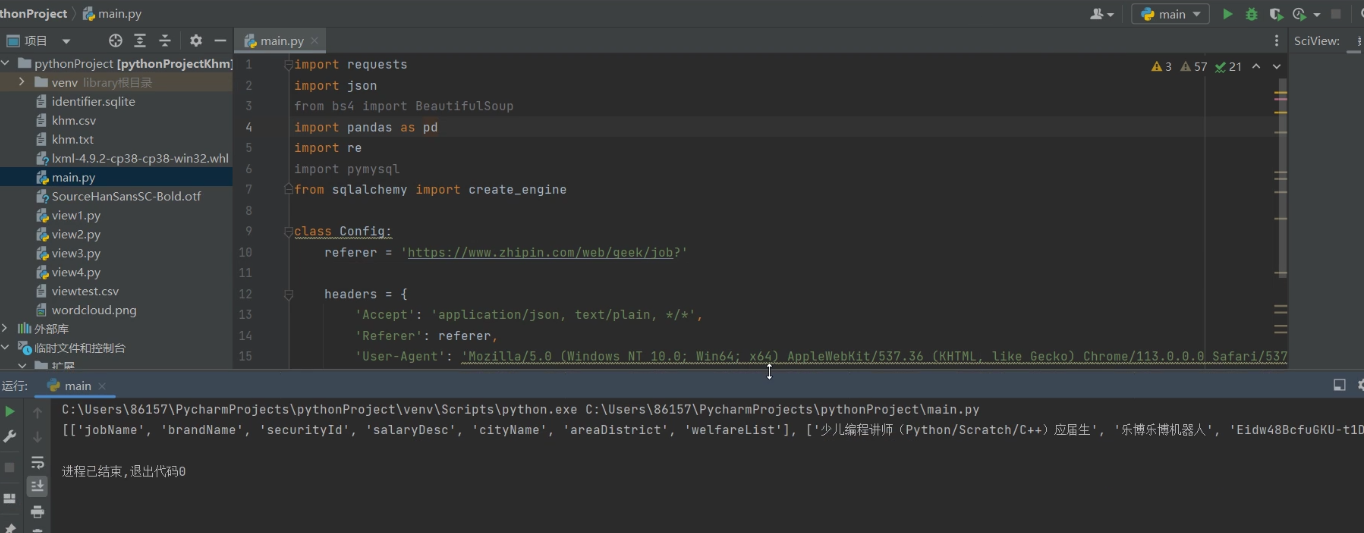
爬取职位接口的json文件,因为该网站页面为异步加载,因此不能使用requests的请求方式,因为页面与数据都是异步加载的。得到网站所以数据
class Config: referer = 'https://www.zhipin.com/web/geek/job?' headers = { 'Accept': 'application/json, text/plain, */*', 'Referer': referer, 'User-Agent': 'Mozilla/5.0 (Windows NT 10.0; Win64; x64) AppleWebKit/537.36 (KHTML, like Gecko) Chrome/113.0.0.0 Safari/537.36', 'Cookie': 'wd_guid=28277dab-9ee3-4c92-af6b-c4c8e49d18b0; historyState=state; _bl_uid=O0lp4hzbr3ggRtiqwwq2smg9p5v4; lastCity=101120100; __g=-; __l=l=%2Fwww.zhipin.com%2Fweb%2Fgeek%2Fjob&r=&g=&s=3&friend_source=0; Hm_lvt_194df3105ad7148dcf2b98a91b5e727a=1686373861; Hm_lpvt_194df3105ad7148dcf2b98a91b5e727a=1686373861; boss_login_mode=sms; wt2=DmPpiUY0gvdJw6vMO0eKquUA17ZYz5cC5w-SFrfXdK3-oL5zYcbEFv2McyR-P1nE2mJ9lO6Jxe0XCzgUzHh1wxg~~; wbg=0; __zp_stoken__=b301eAHgcEDweAxBZUGFcTltfc2wgDDU2JBMuTGVLciRLSjxwNBUPRgpaPAkpd1ojJhxNHAdfek17CX4sKEJWCFsBNWYoTWJZRBhcYxRAJ1ELe1RMb20MCE4ZLABWOxg1ZCV%2FZ3V3EEc2R3o%3D; __c=1686373860; __a=24228598.1686373860..1686373860.9.1.9.9; geek_zp_token=V1RNkgFuH101djVtRvxxsbLiy17TLWwio~' } class Spider: def __init__(self): # 构造器 self.url = Config.referer self.api = 'https://www.zhipin.com/wapi/zpgeek/search/joblist.json?scene=1&query=python&city=101120100&experience=&payType=&partTime=°ree=&industry=&scale=&stage=&position=&jobType=&salary=&multiBusinessDistrict=&multiSubway=&page=1&pageSize=30' # 必须先请求referer网址,实现跳转 self.sess = requests.session() self.sess.get(self.url, headers=Config.headers) def get_position(self): # 向API发起POST请求 r = self.sess.get(self.api,headers=Config.headers, params='python') r.encoding = "utf-8" return r

2.将爬取的数据转化格式
if __name__ == '__main__':
    #创建对象
    khm = Spider()
    #爬取数据
    r = khm.get_position()
    #转化格式
    python_str = json.loads(r.content.decode())
3.将数据进行分割
#创建表格当中对应的数据结构
    excel_totallist = [["jobName", "brandName", "securityId", "salaryDesc", "cityName","areaDistrict","welfareList"]]
    excel_dic = {"khm": excel_totallist}

     #遍历原来的字典的数据结构
    for res_item in python_str["zpData"]["jobList"]:
      item_jobName = res_item["jobName"]
      item_brandName = res_item["brandName"]
      item_securityId = res_item["securityId"]
      item_salaryDesc = khm.get_avgsalary(res_item["salaryDesc"])
      item_cityName = res_item["cityName"]
      item_areaDistrict = res_item["areaDistrict"]
      item_welfareList = res_item["welfareList"]

      itemlist = [item_jobName, item_brandName, item_securityId, item_salaryDesc, item_cityName,item_areaDistrict,item_welfareList]
      excel_totallist.append(itemlist)
    print(excel_totallist)
     #保存excel表格数据
4.清洗所需数据
  def get_avgsalary(self,salary):
        global avg_salary
        if '-' in salary:  # 针对10-20千/月或者10-20万/年的情况,包含-
            low_salary = re.findall(re.compile('(\d*\.?\d+)'), salary)[0]
            high_salary = re.findall(re.compile('(\d?\.?\d+)'), salary)[1]
            avg_salary = (float(low_salary) + float(high_salary))/2*1024/10000
            avg_salary = ('%.2f' % avg_salary)
        avg_salary = str(avg_salary) + '万/月'  # 统一薪资格式
        return avg_salary
5.保存为excel表格
#保存excel表格数据
    df = pd.json_normalize(excel_dic, record_path =['khm'])
    df.to_csv('khm.csv')

(二).可视化分析相关数据
1.制作饼状图相关代码, 从获取的薪资范围列表中分别提取出每个公司给出的最低薪资和最高薪资,并对其分析统计
  1 # 加载数据分析常用库
  2 import csv
  3 import matplotlib.pyplot as plt
  4
  5 filename = r'viewtest.csv'
  6 with open(filename,encoding='utf-8') as f:
  7     # 创建阅读器,调用csv.reader()将前面存储的文件对象作为实参传给他
  8     reader = csv.reader(f)
  9     # 调用next()一次,将文件的第一行存储在header_now中
 10     header_now = next(reader)
 11
 12
 13     # 根据索引提取薪资范围,并存储在列表中
 14     money = []
 15     for row in reader:
 16         money.append(row[4])
 17
 18     """
 19     从获取的薪资范围列表中分别提取出每个公司给出的最低薪资和最高薪资,
 20     并将提取到的字符串转化为float格式存储
 21     """
 22
 23     listmoney = []
 24     for m in money:
 25         num = m.split('-')
 26
 27         # 通过‘-’分割
 28         low = num[0]
 29
 30         # 提取最低薪资
 31         high = num[1].split('K')[0]
 32
 33         # 提取最高薪资,并将后缀单位去除
 34
 35         # 转化数据格式为float
 36         lows = float(low)
 37         highs = float(high)
 38         listmoney.append(lows)
 39         listmoney.append(highs)
 40     print(listmoney)
 41
 42     # 设置变量
 43     one = 0
 44     two = 0
 45     three = 0
 46     four = 0
 47     five = 0
 48     for i in listmoney:
 49         if 0 < i <= 5:
 50             one += 1
 51         elif  5 < i <= 10:
 52             two += 1
 53         elif 10 < i <= 15:
 54             three += 1
 55         elif 15 < i <= 20:
 56             four += 1
 57         elif highs >= 21:
 58             five += 1
 59     print(one ,two ,three ,four ,five)
 60
 61     """
 62
 63     绘制饼图
 64
 65     """
 66     # 用来正常显示中文标签
 67     plt.rcParams['font.sans-serif'] = ['SimHei']
 68
 69     # 图标描述
 70     labels = ['0-5k/月' ,'5-10K/月' ,'10-15k/月' ,'15-20K/月' ,'20+K/月']
 71
 72     # 对应变量
 73     values = [one ,two ,three ,four ,five]
 74
 75     # 旋转角度,将排在第二位的薪资分离出来,突出显示
 76     explode = [0 ,0.05 ,0 ,0 ,0]
 77
 78     # 自定义图例颜色
 79     colors = ['orange' ,'pink' ,'b' ,'g' ,'red']
 80
 81     # 图表题目
 82     plt.title("济南市python数据分析薪资分布" ,fontsize = 16 ,pad=15)
 83
 84     # 各项属性
 85     plt.tick_params(axis='both', which='major', labelsize=26)
 86     """
 87     # autopct='%1.1f%% 设置百分比,保留两位小数
 88
 89     # pctdistance=0.8, #设置百分比标签和圆心的距离
 90
 91     # startangle=180 设置饼图的初始角度
 92     """
 93     plt.pie(values, labels=labels, colors=colors ,pctdistance=0.6 ,explode = explode ,startangle=180, shadow=True,
 94             autopct='%0.2f%%')
 95     # 将横、纵坐标轴标准化处理,保证饼图是一个正圆,否则为椭圆
 96     plt.axis('equal')
 97
 98     # 不显示边框
 99     plt.gca().spines['right'].set_color('none')
100
101     plt.gca().spines['top'].set_color('none')
102
103     plt.gca().spines['left'].set_color('none')
104
105     plt.gca().spines['bottom'].set_color('none')
106     # 显示图片
107     plt.show()

2.制作柱状图及对不同区域含有python工作岗位的数据分析
import seaborn as sns
import matplotlib.pyplot as plt
from matplotlib.font_manager import FontProperties

# 设置字体,防止出现乱码

my_font = FontProperties(fname='SourceHanSansSC-Bold.otf')
plt.rcParams['font.family'] = my_font.get_name()
plt.rcParams['font.weight'] = 'bold'

# 数据
data = [['历下区', 17],
        ['历城区', 7],
        ['天桥区', 1],
        ['槐荫区', 2],
        ['长清区', 4]]

region_colors = ['purple', 'skyblue', 'coral', 'olive', 'thistle']

# 将数据拆分为两个列表
labels, values = zip(*data)

# 创建水平条形图,并调整图表大小
fig, ax = plt.subplots(figsize=(8, 6))
sns.set_style('darkgrid')
ax.barh(labels, values, align='center', color=region_colors)

# 调整字体大小并添加数值标签和区域注释

for i, v in enumerate(values):
    ax.text(v+0.5, i , "%d" %v, va="center", fontsize=8, fontproperties=my_font)
    ax.text(-1.3, i , labels[i], ha="left", va="center", fontsize=8, fontproperties=my_font)

# 添加标题和标签,并使用指定字体

ax.set_title('不同区域的岗位数量', fontweight='bold', fontproperties=my_font)
ax.set_xlabel('岗位数量', fontweight='bold', fontproperties=my_font)
ax.set_ylabel('地区', fontweight='bold', fontproperties=my_font)

# 设置x轴的范围
plt.xlim([0, max(values)+2])

# 隐藏图表顶部和右侧的边框线

ax.spines['top'].set_visible(False)

ax.spines['right'].set_visible(False)

# 显示网格线
ax.grid(True, axis='x', linestyle='--', linewidth=0.5, alpha=0.6)

# 显示图表
plt.show()

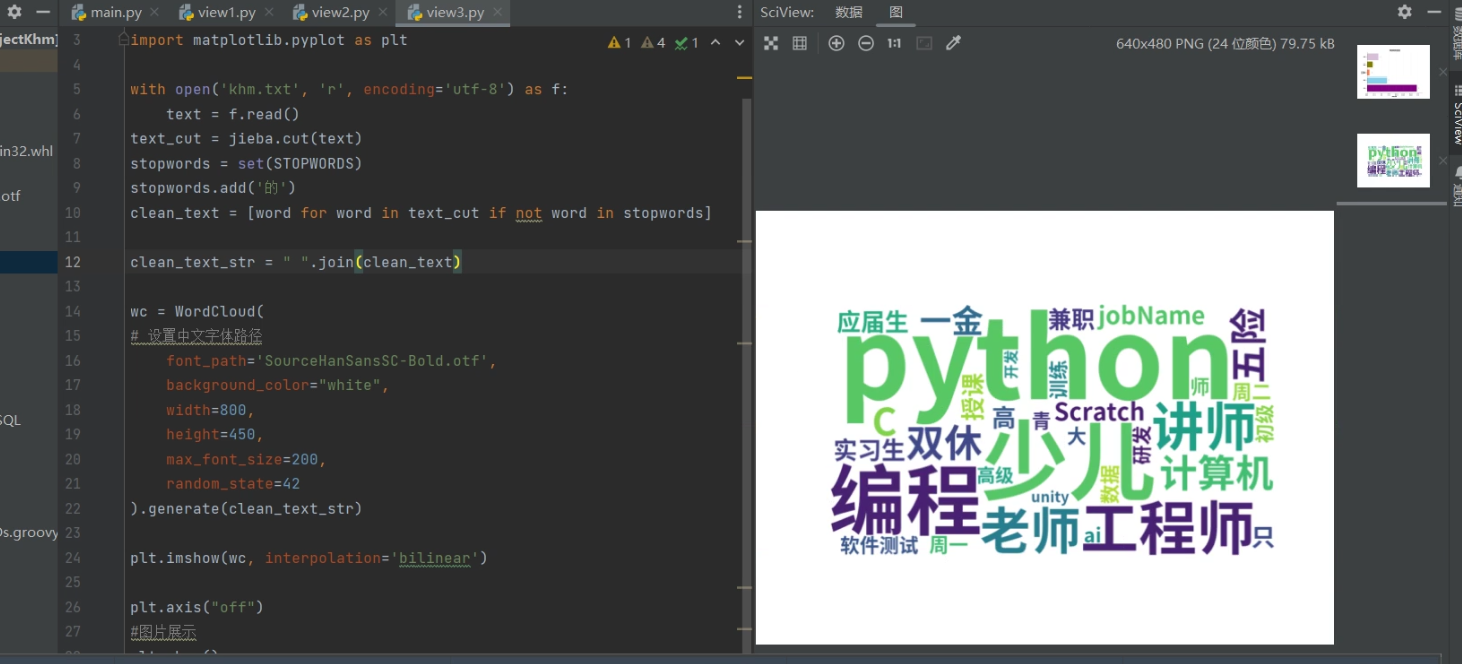
3.制作词云图
import jieba
from wordcloud import WordCloud, STOPWORDS, ImageColorGenerator
import matplotlib.pyplot as plt

with open('khm.txt', 'r', encoding='utf-8') as f:
    text = f.read()
text_cut = jieba.cut(text)
stopwords = set(STOPWORDS)
stopwords.add('的')
clean_text = [word for word in text_cut if not word in stopwords]

clean_text_str = " ".join(clean_text)

wc = WordCloud(
# 设置中文字体路径
    font_path='SourceHanSansSC-Bold.otf',
    background_color="white",
    width=800,
    height=450,
    max_font_size=200,
    random_state=42
).generate(clean_text_str)

plt.imshow(wc, interpolation='bilinear')

plt.axis("off")
#图片展示
plt.show()
#保存
wc.to_file('wordcloud.png')
4.不同职位工资差异的折线图
import matplotlib.pyplot as plt
import pandas as pd

#读取爬取的文件
df = pd.read_csv('khm.csv')
#根据哪一列进行展示

plt.plot(df['3'])
#展示图片
plt.show()

四.完整代码如下
1 import requests 2 import json 3 from bs4 import BeautifulSoup 4 import pandas as pd 5 import re 6 import pymysql 7 from sqlalchemy import create_engine 8 9 class Config: 10 referer = 'https://www.zhipin.com/web/geek/job?' 11 12 headers = { 13 'Accept': 'application/json, text/plain, */*', 14 'Referer': referer, 15 'User-Agent': 'Mozilla/5.0 (Windows NT 10.0; Win64; x64) AppleWebKit/537.36 (KHTML, like Gecko) Chrome/113.0.0.0 Safari/537.36', 16 'Cookie': 'wd_guid=28277dab-9ee3-4c92-af6b-c4c8e49d18b0; historyState=state; _bl_uid=O0lp4hzbr3ggRtiqwwq2smg9p5v4; lastCity=101120100; __g=-; __l=l=%2Fwww.zhipin.com%2Fweb%2Fgeek%2Fjob&r=&g=&s=3&friend_source=0; Hm_lvt_194df3105ad7148dcf2b98a91b5e727a=1686373861; Hm_lpvt_194df3105ad7148dcf2b98a91b5e727a=1686373861; boss_login_mode=sms; wt2=DmPpiUY0gvdJw6vMO0eKquUA17ZYz5cC5w-SFrfXdK3-oL5zYcbEFv2McyR-P1nE2mJ9lO6Jxe0XCzgUzHh1wxg~~; wbg=0; __zp_stoken__=b301eAHgcEDweAxBZUGFcTltfc2wgDDU2JBMuTGVLciRLSjxwNBUPRgpaPAkpd1ojJhxNHAdfek17CX4sKEJWCFsBNWYoTWJZRBhcYxRAJ1ELe1RMb20MCE4ZLABWOxg1ZCV%2FZ3V3EEc2R3o%3D; __c=1686373860; __a=24228598.1686373860..1686373860.9.1.9.9; geek_zp_token=V1RNkgFuH101djVtRvxxsbLiy17TLWwio~' 17 } 18 class Spider: 19 20 def __init__(self): # 构造器 21 self.url = Config.referer 22 self.api = 'https://www.zhipin.com/wapi/zpgeek/search/joblist.json?scene=1&query=python&city=101120100&experience=&payType=&partTime=°ree=&industry=&scale=&stage=&position=&jobType=&salary=&multiBusinessDistrict=&multiSubway=&page=1&pageSize=30' 23 24 # 必须先请求referer网址,实现跳转 25 self.sess = requests.session() 26 self.sess.get(self.url, headers=Config.headers) 27 28 def get_position(self): 29 # 向API发起POST请求 30 r = self.sess.get(self.api,headers=Config.headers, params='python') 31 r.encoding = "utf-8" 32 return r 33 34 # 对薪资进行数据清洗 35 def get_avgsalary(self,salary): 36 global avg_salary 37 if '-' in salary: # 针对10-20千/月或者10-20万/年的情况,包含- 38 low_salary = re.findall(re.compile('(\d*\.?\d+)'), salary)[0] 39 high_salary = re.findall(re.compile('(\d?\.?\d+)'), salary)[1] 40 avg_salary = (float(low_salary) + float(high_salary))/2*1024/10000 41 avg_salary = ('%.2f' % avg_salary) 42 avg_salary = str(avg_salary) + '万/月' # 统一薪资格式 43 return avg_salary 44 45 46 def ConnectDB(self): 47 #链接数据库 48 conn = create_engine('mysql+pymysql://{}:{}@{}:{}/{}'.format('root', 123456,'localhost', 3306,'mysql')) 49 data = pd.read_csv("khm.csv") 50 data.to_sql('boss',conn,if_exists='append',chunksize=100000,index=None) 51 print('存入成功') 52 53 if __name__ == '__main__': 54 #创建对象 55 khm = Spider() 56 #爬取数据 57 r = khm.get_position() 58 #转化格式 59 python_str = json.loads(r.content.decode()) 60 61 #创建表格当中对应的数据结构 62 excel_totallist = [["jobName", "brandName", "securityId", "salaryDesc", "cityName","areaDistrict","welfareList"]] 63 excel_dic = {"khm": excel_totallist} 64 65 #遍历原来的字典的数据结构 66 for res_item in python_str["zpData"]["jobList"]: 67 item_jobName = res_item["jobName"] 68 item_brandName = res_item["brandName"] 69 item_securityId = res_item["securityId"] 70 item_salaryDesc = khm.get_avgsalary(res_item["salaryDesc"]) 71 item_cityName = res_item["cityName"] 72 item_areaDistrict = res_item["areaDistrict"] 73 item_welfareList = res_item["welfareList"] 74 75 itemlist = [item_jobName, item_brandName, item_securityId, item_salaryDesc, item_cityName,item_areaDistrict,item_welfareList] 76 excel_totallist.append(itemlist) 77 print(excel_totallist) 78 #保存excel表格数据 79 df = pd.json_normalize(excel_dic, record_path =['khm']) 80 df.to_csv('khm.csv') 81 82 #将csv文件保存到数据库 83 # khm.ConnectDB() 84 85 import csv 86 import matplotlib.pyplot as plt 87 88 filename = r'viewtest.csv' 89 with open(filename,encoding='utf-8') as f: 90 # 创建阅读器,调用csv.reader()将前面存储的文件对象作为实参传给他 91 reader = csv.reader(f) 92 # 调用next()一次,将文件的第一行存储在header_now中 93 header_now = next(reader) 94 95 96 # 根据索引提取薪资范围,并存储在列表中 97 money = [] 98 for row in reader: 99 money.append(row[4]) 100 101 """ 102 从获取的薪资范围列表中分别提取出每个公司给出的最低薪资和最高薪资, 103 并将提取到的字符串转化为float格式存储 104 """ 105 106 listmoney = [] 107 for m in money: 108 num = m.split('-') 109 110 # 通过‘-’分割 111 low = num[0] 112 113 # 提取最低薪资 114 high = num[1].split('K')[0] 115 116 # 提取最高薪资,并将后缀单位去除 117 118 # 转化数据格式为float 119 lows = float(low) 120 highs = float(high) 121 listmoney.append(lows) 122 listmoney.append(highs) 123 print(listmoney) 124 125 # 设置变量 126 one = 0 127 two = 0 128 three = 0 129 four = 0 130 five = 0 131 for i in listmoney: 132 if 0 < i <= 5: 133 one += 1 134 elif 5 < i <= 10: 135 two += 1 136 elif 10 < i <= 15: 137 three += 1 138 elif 15 < i <= 20: 139 four += 1 140 elif highs >= 21: 141 five += 1 142 print(one ,two ,three ,four ,five) 143 144 """ 145 146 绘制饼图 147 148 """ 149 # 用来正常显示中文标签 150 plt.rcParams['font.sans-serif'] = ['SimHei'] 151 152 # 图标描述 153 labels = ['0-5k/月' ,'5-10K/月' ,'10-15k/月' ,'15-20K/月' ,'20+K/月'] 154 155 # 对应变量 156 values = [one ,two ,three ,four ,five] 157 158 # 旋转角度,将排在第二位的薪资分离出来,突出显示 159 explode = [0 ,0.05 ,0 ,0 ,0] 160 161 # 自定义图例颜色 162 colors = ['orange' ,'pink' ,'b' ,'g' ,'red'] 163 164 # 图表题目 165 plt.title("济南市python数据分析薪资分布" ,fontsize = 16 ,pad=15) 166 167 # 各项属性 168 plt.tick_params(axis='both', which='major', labelsize=26) 169 """ 170 # autopct='%1.1f%% 设置百分比,保留两位小数 171 172 # pctdistance=0.8, #设置百分比标签和圆心的距离 173 174 # startangle=180 设置饼图的初始角度 175 """ 176 plt.pie(values, labels=labels, colors=colors ,pctdistance=0.6 ,explode = explode ,startangle=180, shadow=True, 177 autopct='%0.2f%%') 178 # 将横、纵坐标轴标准化处理,保证饼图是一个正圆,否则为椭圆 179 plt.axis('equal') 180 181 # 不显示边框 182 plt.gca().spines['right'].set_color('none') 183 184 plt.gca().spines['top'].set_color('none') 185 186 plt.gca().spines['left'].set_color('none') 187 188 plt.gca().spines['bottom'].set_color('none') 189 # 显示图片 190 plt.show() 191 192 import seaborn as sns 193 import matplotlib.pyplot as plt 194 from matplotlib.font_manager import FontProperties 195 196 # 设置字体,防止出现乱码 197 198 my_font = FontProperties(fname='SourceHanSansSC-Bold.otf') 199 plt.rcParams['font.family'] = my_font.get_name() 200 plt.rcParams['font.weight'] = 'bold' 201 202 # 数据 203 data = [['历下区', 17], 204 ['历城区', 7], 205 ['天桥区', 1], 206 ['槐荫区', 2], 207 ['长清区', 4]] 208 209 region_colors = ['purple', 'skyblue', 'coral', 'olive', 'thistle'] 210 211 # 将数据拆分为两个列表 212 labels, values = zip(*data) 213 214 # 创建水平条形图,并调整图表大小 215 fig, ax = plt.subplots(figsize=(8, 6)) 216 sns.set_style('darkgrid') 217 ax.barh(labels, values, align='center', color=region_colors) 218 219 # 调整字体大小并添加数值标签和区域注释 220 221 for i, v in enumerate(values): 222 ax.text(v+0.5, i , "%d" %v, va="center", fontsize=8, fontproperties=my_font) 223 ax.text(-1.3, i , labels[i], ha="left", va="center", fontsize=8, fontproperties=my_font) 224 225 # 添加标题和标签,并使用指定字体 226 227 ax.set_title('不同区域的岗位数量', fontweight='bold', fontproperties=my_font) 228 ax.set_xlabel('岗位数量', fontweight='bold', fontproperties=my_font) 229 ax.set_ylabel('地区', fontweight='bold', fontproperties=my_font) 230 231 # 设置x轴的范围 232 plt.xlim([0, max(values)+2]) 233 234 # 隐藏图表顶部和右侧的边框线 235 236 ax.spines['top'].set_visible(False) 237 238 ax.spines['right'].set_visible(False) 239 240 # 显示网格线 241 ax.grid(True, axis='x', linestyle='--', linewidth=0.5, alpha=0.6) 242 243 # 显示图表 244 plt.show() 245 246 import jieba 247 from wordcloud import WordCloud, STOPWORDS, ImageColorGenerator 248 import matplotlib.pyplot as plt 249 250 with open('khm.txt', 'r', encoding='utf-8') as f: 251 text = f.read() 252 text_cut = jieba.cut(text) 253 stopwords = set(STOPWORDS) 254 stopwords.add('的') 255 clean_text = [word for word in text_cut if not word in stopwords] 256 257 clean_text_str = " ".join(clean_text) 258 259 wc = WordCloud( 260 # 设置中文字体路径 261 font_path='SourceHanSansSC-Bold.otf', 262 background_color="white", 263 width=800, 264 height=450, 265 max_font_size=200, 266 random_state=42 267 ).generate(clean_text_str) 268 269 plt.imshow(wc, interpolation='bilinear') 270 271 plt.axis("off") 272 #图片展示 273 plt.show() 274 #保存 275 wc.to_file('wordcloud.png') 276 277 import matplotlib.pyplot as plt 278 import pandas as pd 279 280 #读取爬取的文件 281 df = pd.read_csv('khm.csv') 282 #根据哪一列进行展示 283 284 plt.plot(df['3']) 285 #展示图片 286 plt.show()
五.总结
对于这次主题的数据可视化有以下结论
1.同类型行业不同职位的薪资有较大差异,最大差异甚至可以达到最高薪资为最低薪资的两倍,所以以后就业需要紧跟自身能力范围内找到最好的
2.python相关行业薪资大于10k的少于整体的50%
2.不同地区对同一职位有不同需求,越发达的地区python相关行业的职位要求更大
总体来说符合自己的预期效果
对此次课程设计的收获以及改进意见
1.对python相关知识有了更加深刻,系统的了解,完善了相关知识
2.更加切身体会到了python这个编程语言的灵活性,以及爬虫技术的不易
3.网址的反爬虫技术常使得编程受阻,让人不得不改变方向
3.希望自己以后对编程的理解能够更深入,在爬取和分析数据的时候灵敏度更高
4.能够更加自如的掌握数据分析,爬取jishu