001、
ggplot(mpg, aes(displ, hwy)) +
  geom_point(aes(color = drv)) +
  coord_cartesian(xlim = c(5, 7), ylim = c(10, 30))     ## 设定x、y轴范围

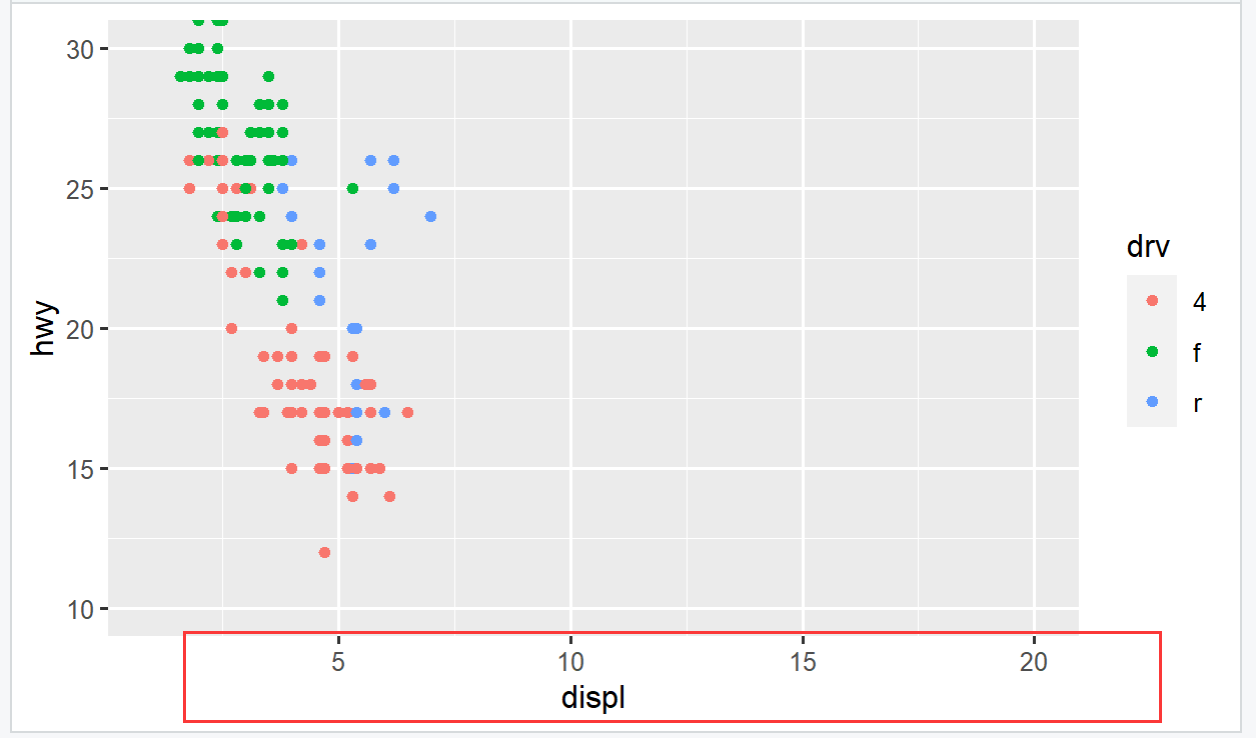
002、 修改x轴范围
ggplot(mpg, aes(displ, hwy)) +
  geom_point(aes(color = drv)) +
  coord_cartesian(xlim = c(1, 20), ylim = c(10, 30))    ## 修改x轴的范围
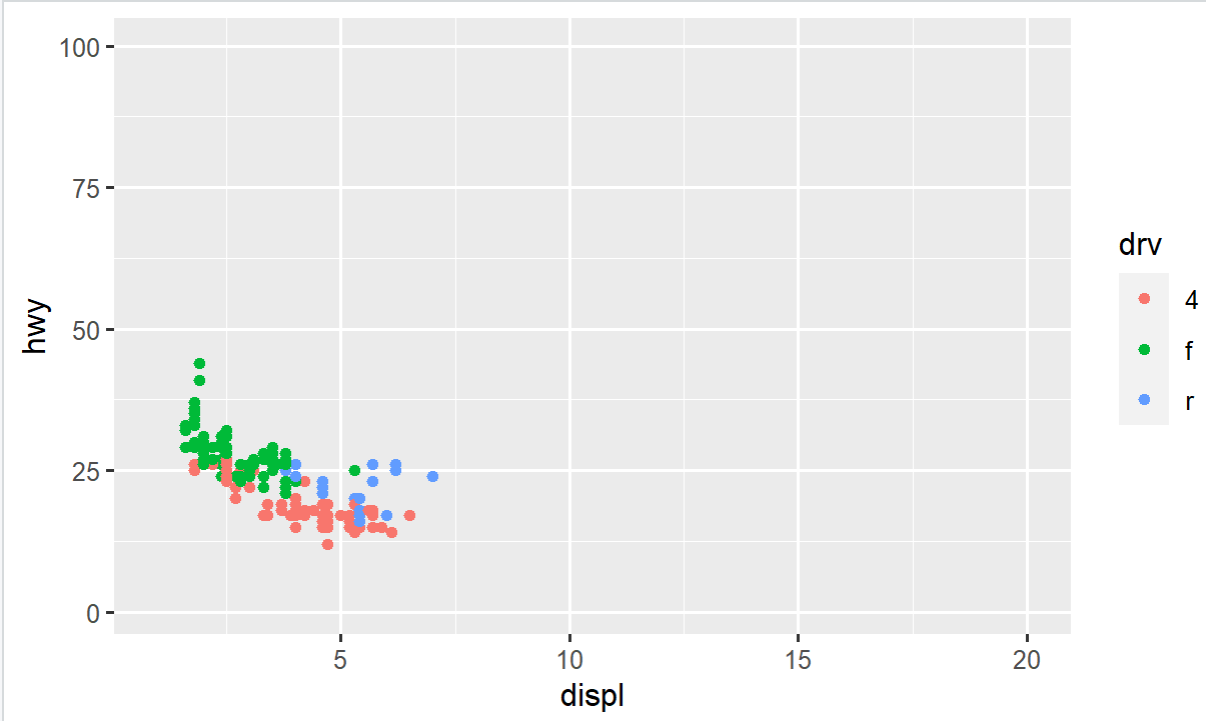
003、修改y轴范围
ggplot(mpg, aes(displ, hwy)) +
  geom_point(aes(color = drv)) +
  coord_cartesian(xlim = c(1, 20), ylim = c(1, 100))        ## 修改y轴范围
。