1、安装conda 类似npm的n
https://www.jianshu.com/p/544a4c8a8186
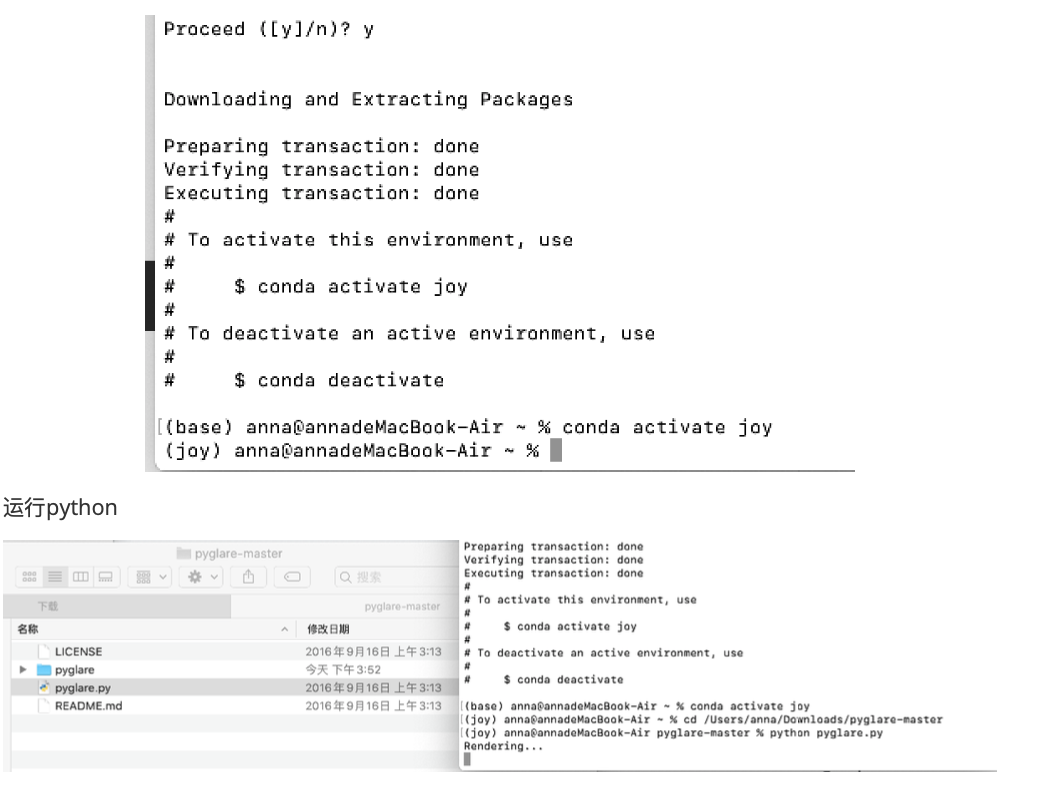
# 安装python 以及依赖
conda create -n joy python==3.10.10
# 激活环境
conda activate myenv
2、安装交互式数据分析包streamlit
https://zhuanlan.zhihu.com/p/257074934
streamlit run streamlitDemo.py
注意安装依赖包,文件格式和语句,避免报错
import streamlit as st
import pandas as pd
import numpy as np
import matplotlib.pyplot as plt import plotly.figure_factory as ff
# st.title("streamlit demo")
@st.cache
def load_data(path):
df = pd.read_csv(path)
df.columns = df.columns.str.lower()
# df['date'] = pd.to_datetime(df['transaction_date']).dt.date # df['price'] = df['price'].str.replace(",",'').astype(float) return df
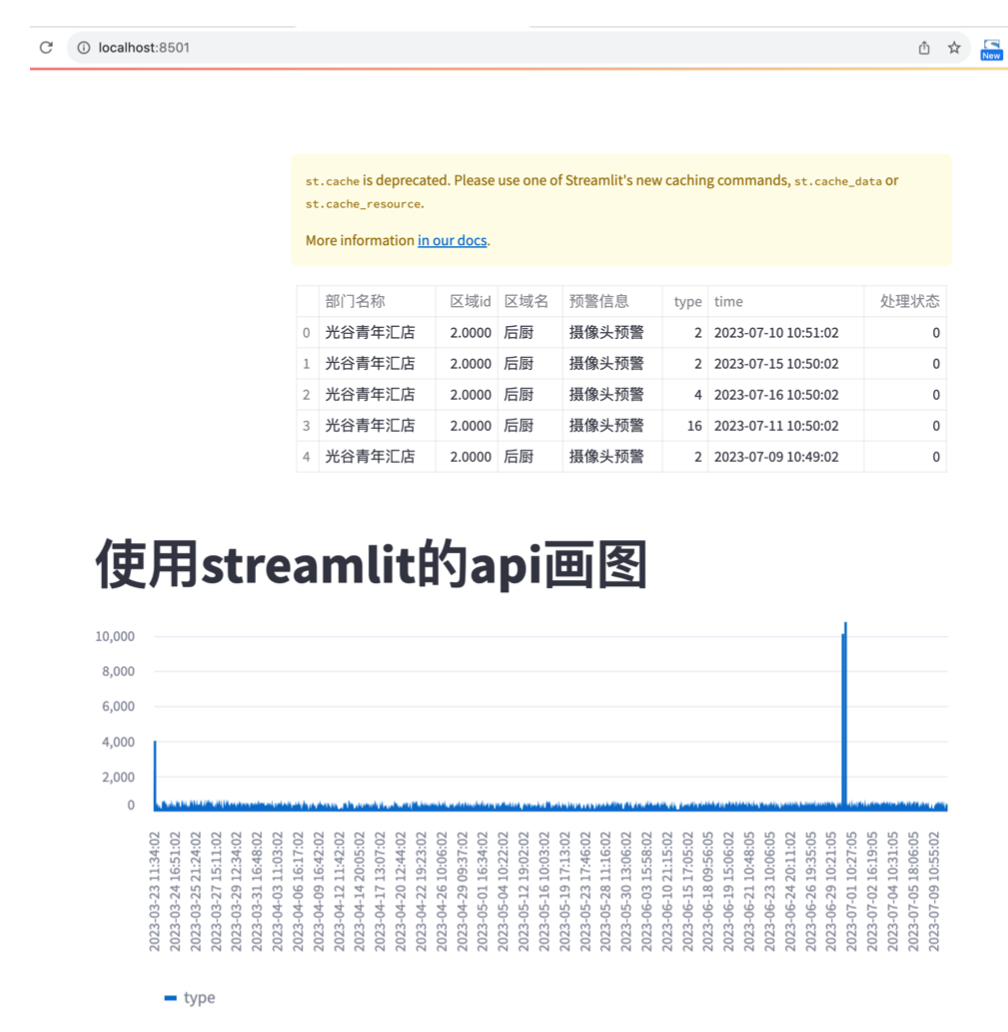
df = load_data("warningMsgMgt2.csv") st.table(df.head(5))
#####
st.title('使用streamlit的api画图')
sub_df = df[['type', 'time']]
sub_df = sub_df.groupby('time').agg(sum) st.line_chart(sub_df["type"])
#####
st.title('使用plotly的api画图')
fig = ff.create_distplot([sub_df['type']], group_labels = ['time'], bin_size=2500)
st.plotly_chart(fig, use_container_width=True)
更多好玩的例子
https://share.streamlit.io/redirect
https://docs.streamlit.io/ 文档
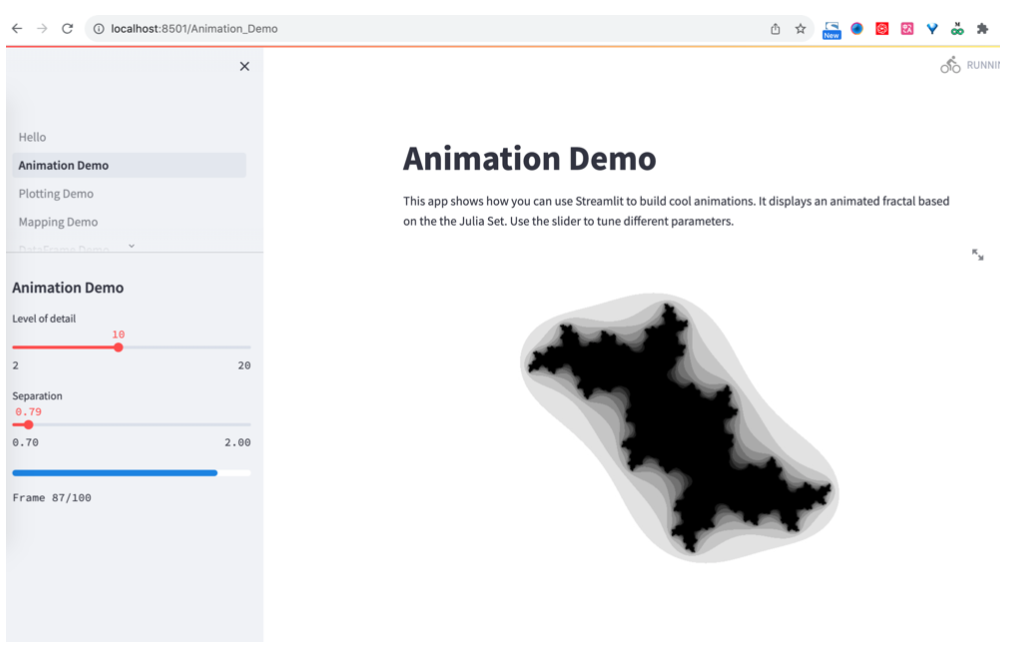
streamlit hello