vSAN集群监控,有一个主动测试功能,里面可以针对vSAN主机进行虚拟机创建测试、网络性能测试等。
官方解释:
- 虚拟机创建测试通常需要 20 至 40 秒时间,在超时情况下最长需要 180 秒时间。将为每个主机生成一个虚拟机创建任务和一个删除任务,这些任务将显示在任务控制台中。
- 网络性能测试旨在评估是否存在连接问题以及主机间的网络带宽是否能够满足 vSAN 的要求。
使用该功能需要提前启用 vSAN 性能服务的网络诊断模式,设置路径:vSAN服务配置 - 性能服务 - 网络诊断模式。

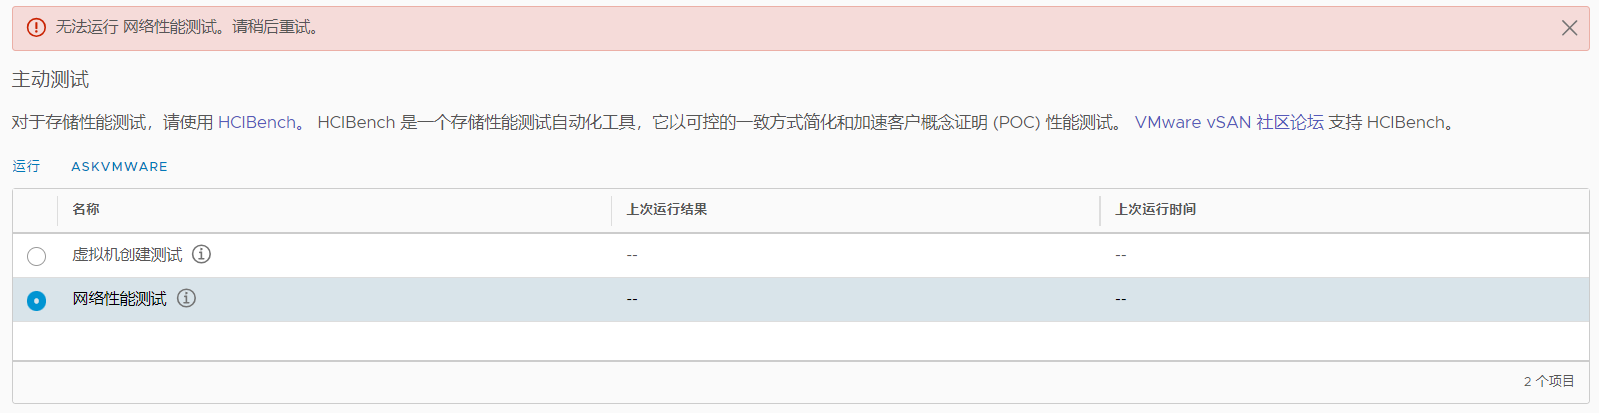
现在运行网络性能测试后,平台出现错误,提示“无法运行 网络性能测试。请稍后重试。”。
SSH连接到vCenter Shell,进入到/storage/log/vmware/vsan-health目录,查看tail -n 300 vmware-vsan-health-service.log日志,发现以下内容:
2023-12-05T09:00:15.528Z INFO vsan-mgmt[61232] [VsanVcClusterHealthSystemImpl::QueryClusterNetworkPerfTest opID=a89d241a] Run network(unicast) performance test
2023-12-05T09:00:15.551Z INFO vsan-mgmt[Thread-276] [VsanClusterHealthSystemImpl::PerHostIperfThreadMain opID=a89d241a] Launching iperf server on esxi-a1.lab.com
2023-12-05T09:00:15.554Z INFO vsan-mgmt[Thread-278] [VsanClusterHealthSystemImpl::PerHostIperfThreadMain opID=a89d241a] Launching iperf server on esxi-a2.lab.com
2023-12-05T09:00:15.558Z INFO vsan-mgmt[Thread-280] [VsanClusterHealthSystemImpl::PerHostIperfThreadMain opID=a89d241a] Launching iperf server on esxi-a4.lab.com
2023-12-05T09:00:15.560Z INFO vsan-mgmt[Thread-282] [VsanClusterHealthSystemImpl::PerHostIperfThreadMain opID=a89d241a] Launching iperf server on esxi-a3.lab.com
2023-12-05T09:00:22.947Z INFO vsan-mgmt[Thread-8] [VsanPyVmomiProfiler::logProfile opID=noOpId]   invoke-method:ServiceInstance:CurrentTime: 0.00s
2023-12-05T09:00:25.037Z INFO vsan-mgmt[Thread-286] [VsanSupportBundleHelper::parseSystemProxies opID=noOpId] VCSA proxy is disabled.
2023-12-05T09:00:27.042Z ERROR vsan-mgmt[Thread-286] [VsanHttpRequestWrapper::urlopen opID=noOpId] Exception while sending request : <urlopen error [Errno 99] Cannot assign requested address>
2023-12-05T09:00:45.584Z INFO vsan-mgmt[Thread-277] [VsanClusterHealthSystemImpl::PerHostIperfThreadMain opID=a89d241a] Launching iperf client on esxi-a3.lab.com
2023-12-05T09:00:45.586Z INFO vsan-mgmt[Thread-279] [VsanClusterHealthSystemImpl::PerHostIperfThreadMain opID=a89d241a] Launching iperf client on esxi-a1.lab.com
2023-12-05T09:00:45.589Z INFO vsan-mgmt[Thread-281] [VsanClusterHealthSystemImpl::PerHostIperfThreadMain opID=a89d241a] Launching iperf client on esxi-a2.lab.com
2023-12-05T09:00:45.592Z INFO vsan-mgmt[Thread-283] [VsanClusterHealthSystemImpl::PerHostIperfThreadMain opID=a89d241a] Launching iperf client on esxi-a4.lab.com
2023-12-05T09:01:00.191Z INFO vsan-mgmt[ClusterGenMonitor] [VsanPyVmomiProfiler::log opID=noOpId] Profiler:
2023-12-05T09:01:00.191Z INFO vsan-mgmt[ClusterGenMonitor] [VsanPyVmomiProfiler::logProfile opID=noOpId]   GetState: 0.02s
2023-12-05T09:01:00.199Z INFO vsan-mgmt[ClusterGenMonitor] [VsanPyVmomiProfiler::log opID=noOpId] Profiler:
2023-12-05T09:01:00.200Z INFO vsan-mgmt[ClusterGenMonitor] [VsanPyVmomiProfiler::logProfile opID=noOpId]   GetState: 0.01s
2023-12-05T09:01:00.214Z INFO vsan-mgmt[ClusterGenMonitor] [VsanPyVmomiProfiler::logProfile opID=noOpId]   invoke-accessor:ServiceInstance:content: 0.01s
2023-12-05T09:01:00.224Z INFO vsan-mgmt[ClusterGenMonitor] [VsanPyVmomiProfiler::log opID=noOpId] Profiler:
2023-12-05T09:01:00.224Z INFO vsan-mgmt[ClusterGenMonitor] [VsanPyVmomiProfiler::logProfile opID=noOpId]   GetState: 0.00s
2023-12-05T09:01:05.141Z INFO vsan-mgmt[EventMonitor] [VsanEventUtil::_collectClustersEventsFromCache opID=noOpId] skip cluster vsan without updated timestamp : 2023-12-05 08:54:48.732163+00:00
2023-12-05T09:01:05.273Z INFO vsan-mgmt[Thread-289] [VsanPyVmomiProfiler::logProfile opID=noOpId]   invoke-method:ha-vsan-health-system:WaitForVsanHealthGenerationIdChange: 5.04s:esxi-a4.lab.com
2023-12-05T09:01:05.276Z INFO vsan-mgmt[Thread-288] [VsanPyVmomiProfiler::logProfile opID=noOpId]   invoke-method:ha-vsan-health-system:WaitForVsanHealthGenerationIdChange: 5.04s:esxi-a1.lab.com
2023-12-05T09:01:05.281Z INFO vsan-mgmt[Thread-290] [VsanPyVmomiProfiler::logProfile opID=noOpId]   invoke-method:ha-vsan-health-system:WaitForVsanHealthGenerationIdChange: 5.04s:esxi-a3.lab.com
2023-12-05T09:01:05.284Z INFO vsan-mgmt[Thread-291] [VsanPyVmomiProfiler::logProfile opID=noOpId]   invoke-method:ha-vsan-health-system:WaitForVsanHealthGenerationIdChange: 5.04s:esxi-a2.lab.com
2023-12-05T09:01:05.285Z INFO vsan-mgmt[ClusterGenMonitor] [VsanVcClusterUtil::WaitVsanClustersGenerationIdChange opID=noOpId] Get hosts generation ID change result : {'vim.HostSystem:host-33': False, 'vim.HostSystem:host-42': False, 'vim.HostSystem:host-39': False, 'vim.HostSystem:host-36': False}
2023-12-05T09:01:05.286Z INFO vsan-mgmt[ClusterGenMonitor] [VsanPyVmomiProfiler::log opID=noOpId] Profiler:
2023-12-05T09:01:05.286Z INFO vsan-mgmt[ClusterGenMonitor] [VsanPyVmomiProfiler::logProfile opID=noOpId]   ClusterHostsConnStateManager.GetHostsConnState: 0.02s
2023-12-05T09:01:11.749Z INFO vsan-mgmt[Thread-281] [VsanPyVmomiProfiler::logProfile opID=a89d241a]   invoke-method:ha-vsan-health-system:QueryRunIperfClient: 26.16s:esxi-a2.lab.com
2023-12-05T09:01:11.750Z INFO vsan-mgmt[Thread-281] [VsanClusterHealthSystemImpl::PerHostIperfThreadMain opID=a89d241a] Iperf finished on esxi-a2.lab.com
2023-12-05T09:01:11.798Z INFO vsan-mgmt[Thread-277] [VsanPyVmomiProfiler::logProfile opID=a89d241a]   invoke-method:ha-vsan-health-system:QueryRunIperfClient: 26.21s:esxi-a3.lab.com
2023-12-05T09:01:11.799Z INFO vsan-mgmt[Thread-277] [VsanClusterHealthSystemImpl::PerHostIperfThreadMain opID=a89d241a] Iperf finished on esxi-a3.lab.com
2023-12-05T09:01:11.817Z INFO vsan-mgmt[Thread-279] [VsanPyVmomiProfiler::logProfile opID=a89d241a]   invoke-method:ha-vsan-health-system:QueryRunIperfClient: 26.23s:esxi-a1.lab.com
2023-12-05T09:01:11.817Z INFO vsan-mgmt[Thread-279] [VsanClusterHealthSystemImpl::PerHostIperfThreadMain opID=a89d241a] Iperf finished on esxi-a1.lab.com
2023-12-05T09:01:11.946Z INFO vsan-mgmt[Thread-283] [VsanPyVmomiProfiler::logProfile opID=a89d241a]   invoke-method:ha-vsan-health-system:QueryRunIperfClient: 26.35s:esxi-a4.lab.com
2023-12-05T09:01:11.947Z INFO vsan-mgmt[Thread-283] [VsanClusterHealthSystemImpl::PerHostIperfThreadMain opID=a89d241a] Iperf finished on esxi-a4.lab.com
2023-12-05T09:01:15.968Z INFO vsan-mgmt[Thread-280] [VsanPyVmomiProfiler::logProfile opID=a89d241a]   invoke-method:ha-vsan-health-system:QueryRunIperfServer: 60.41s:esxi-a4.lab.com
2023-12-05T09:01:15.970Z INFO vsan-mgmt[Thread-280] [VsanClusterHealthSystemImpl::PerHostIperfThreadMain opID=a89d241a] Iperf finished on esxi-a4.lab.com
2023-12-05T09:01:16.160Z INFO vsan-mgmt[Thread-276] [VsanPyVmomiProfiler::logProfile opID=a89d241a]   invoke-method:ha-vsan-health-system:QueryRunIperfServer: 60.61s:esxi-a1.lab.com
2023-12-05T09:01:16.162Z INFO vsan-mgmt[Thread-276] [VsanClusterHealthSystemImpl::PerHostIperfThreadMain opID=a89d241a] Iperf finished on esxi-a1.lab.com
2023-12-05T09:01:16.199Z INFO vsan-mgmt[Thread-282] [VsanPyVmomiProfiler::logProfile opID=a89d241a]   invoke-method:ha-vsan-health-system:QueryRunIperfServer: 60.64s:esxi-a3.lab.com
2023-12-05T09:01:16.200Z INFO vsan-mgmt[Thread-282] [VsanClusterHealthSystemImpl::PerHostIperfThreadMain opID=a89d241a] Iperf finished on esxi-a3.lab.com
2023-12-05T09:01:16.458Z INFO vsan-mgmt[Thread-278] [VsanPyVmomiProfiler::logProfile opID=a89d241a]   invoke-method:ha-vsan-health-system:QueryRunIperfServer: 60.90s:esxi-a2.lab.com
2023-12-05T09:01:16.459Z INFO vsan-mgmt[Thread-278] [VsanClusterHealthSystemImpl::PerHostIperfThreadMain opID=a89d241a] Iperf finished on esxi-a2.lab.com
2023-12-05T09:01:16.461Z INFO vsan-mgmt[61232] [VsanClusterHealthSystemImpl::QueryClusterNetworkPerfTest opID=a89d241a] Iperf result: (vim.cluster.VsanClusterNetworkLoadTestResult) {
   clusterResult = (vim.cluster.VsanClusterProactiveTestResult) {
      overallStatus = 'yellow',
      overallStatusDescription = '',
      timestamp = 2023-12-05T09:01:16.460179Z,
      healthTest = <unset>
   },
   hostResults = (vim.host.VsanNetworkLoadTestResult) [
      (vim.host.VsanNetworkLoadTestResult) {
         hostname = 'esxi-a3.lab.com',
         status = 'yellow',
         client = true,
         bandwidthBps = 74740481,
         totalBytes = 1121195648,
         lostDatagrams = <unset>,
         lossPct = <unset>,
         sentDatagrams = <unset>,
         jitterMs = <unset>
      },
      (vim.host.VsanNetworkLoadTestResult) {
         hostname = 'esxi-a4.lab.com',
         status = 'yellow',
         client = true,
         bandwidthBps = 31971322,
         totalBytes = 479586696,
         lostDatagrams = <unset>,
         lossPct = <unset>,
         sentDatagrams = <unset>,
         jitterMs = <unset>
      },
      (vim.host.VsanNetworkLoadTestResult) {
         hostname = 'esxi-a1.lab.com',
         status = 'yellow',
         client = true,
         bandwidthBps = 31321318,
         totalBytes = 469799320,
         lostDatagrams = <unset>,
         lossPct = <unset>,
         sentDatagrams = <unset>,
         jitterMs = <unset>
      },
      (vim.host.VsanNetworkLoadTestResult) {
         hostname = 'esxi-a2.lab.com',
         status = 'yellow',
         client = true,
         bandwidthBps = 75505704,
         totalBytes = 1132633816,
         lostDatagrams = <unset>,
         lossPct = <unset>,
         sentDatagrams = <unset>,
         jitterMs = <unset>
      }
   ]
}
2023-12-05T09:01:16.461Z INFO vsan-mgmt[61232] [VsanPyVmomiProfiler::log opID=a89d241a] Profiler:
2023-12-05T09:01:16.462Z INFO vsan-mgmt[61232] [VsanPyVmomiProfiler::logProfile opID=a89d241a]   GetClusterHostInfo.PopulateCapabilities: 0.06s
2023-12-05T09:01:16.462Z INFO vsan-mgmt[61232] [VsanPyVmomiProfiler::logProfile opID=a89d241a]   GetClusterHostInfos: 0.12s
2023-12-05T09:01:16.463Z INFO vsan-mgmt[61232] [VsanPyVmomiProfiler::logProfile opID=a89d241a]   GetClusterHostInfos.CollectMultiple_host: 0.00s
2023-12-05T09:01:16.463Z INFO vsan-mgmt[61232] [VsanPyVmomiProfiler::logProfile opID=a89d241a]   GetClusterHostInfos.CollectMultiple_hostConfig: 0.04s
2023-12-05T09:01:16.465Z INFO vsan-mgmt[61232] [VsanPyVmomiProfiler::logProfile opID=a89d241a]   GetClusterHostInfos.CollectMultiple_vsanSysConfig: 0.01s
2023-12-05T09:01:16.465Z INFO vsan-mgmt[61232] [VsanPyVmomiProfiler::logProfile opID=a89d241a]   GetClusterHostInfos.getWitnessHost: 0.00s
2023-12-05T09:01:16.466Z INFO vsan-mgmt[61232] [VsanPyVmomiProfiler::logProfile opID=a89d241a]   clusterAdapter.GetState: 0.00s
2023-12-05T09:01:16.466Z INFO vsan-mgmt[61232] [VsanPyVmomiProfiler::logProfile opID=a89d241a]   impl.QueryClusterNetworkPerfTest: 60.93s
从上面日志可以看出,其实在运行网络性能测试后,后台是已经成功执行了的,那为什么平台提示运行错误呢?
我的环境是VMware vSAN 6.7 U3,VMware vCenter 6.7 U3,之前因为VMware vCenter Server高危漏洞做过升级,现在是U3t。
怀疑这可能是个bug......
如果想正常运行网络性能测试,并且展示出来,可以在vCenter右上角,选择我的首选项,将vSphere Client的语言修改为英文或者其他语言,再重新执行即可。

修改语言为英文后,运行正常。

其他补充:

