一、选题的背景
随着人们对天气的关注逐渐增加,天气预报数据的获取与可视化成为了当今的热门话题,天气预报我们每天都会关注,天气情况会影响到我们日常的增减衣物、出行安排等。每天的气温、相对湿度、降水量以及风向风速是关注的焦点。通过Python网络爬虫爬取天气预报让我们快速获取和分析大量的天气数据,并通过可视化手段展示其特征和规律。这将有助于人们更好地理解和应用天气数据,从而做出更准确的决策和规划
二、主题式网络爬虫设计方案
1. 主题式网络爬虫名称:天气预报爬取数据与可视化数据
2. 主题式网络爬虫爬取的内容与数据特征分析:
- 爬取内容:天气预报网站上的历史天气数据 包括(日期,最高温度,最低温度,天气,风向)等信息
- 数据特征分析:时效性,完整性,结构化,可预测性等特性
3. 主题式网络爬虫设计方案概述
-实现思路:本次设计方案首先分析网站页面主要使用requests爬虫程序,实现网页的请求、解析、过滤、存储等,通过pandas库对数据进行分析和数据可视化处理。
-该过程遇到的难点:动态加载、反爬虫、导致爬虫难以获取和解析数据,数据可视化的效果和美观性
三、主题页面的结构特征分析
1)主题页面的结构与特征分析
(1) 导航栏位于界面顶部
(2) 右侧热门城市历史天气
(3) 中间是内容区海口气温走势图以及风向统计
(4) 页面底部是网站信息和网站服务
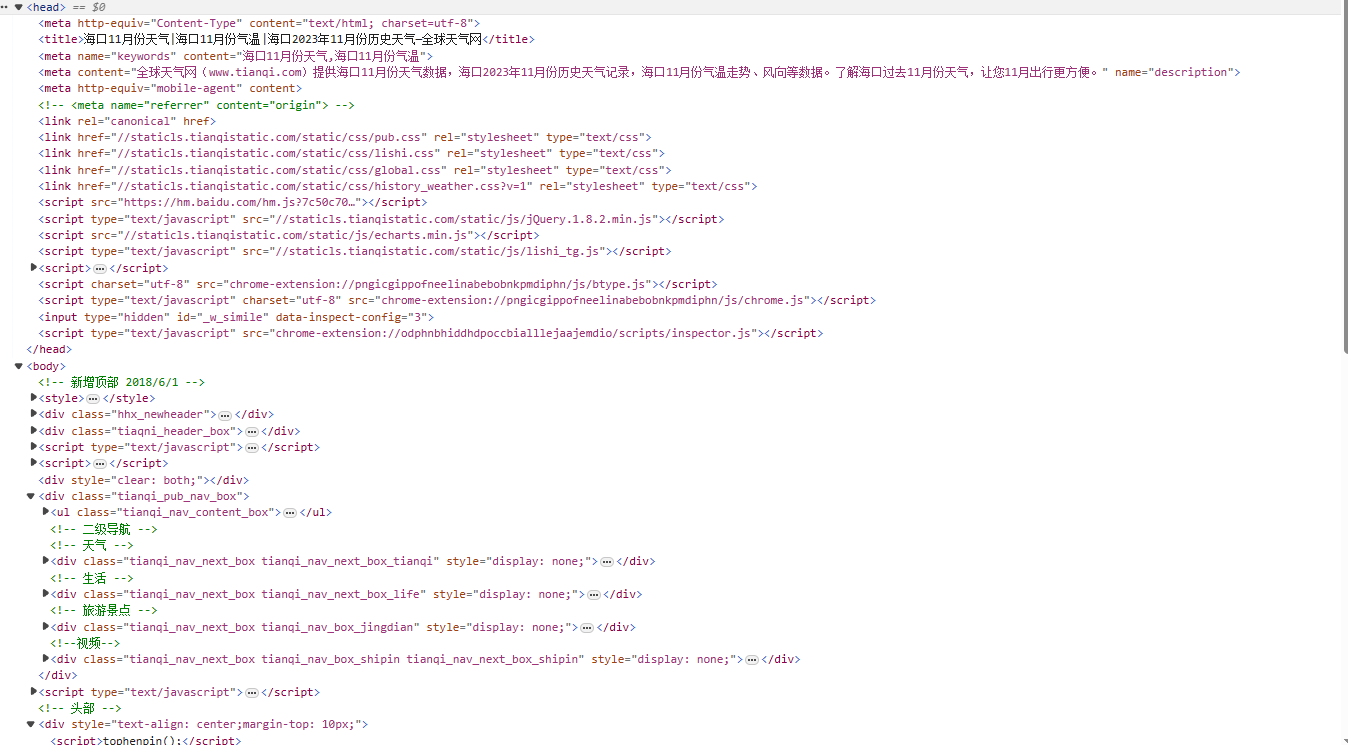
2. Htmls 页面解析
class="tianqi_pub_nav_box"顶部导航栏
class="tianqi_pub_nav_box"右侧热门城市历史天气
<section class=”rank-content”> 内容区
<div class=”footer”> 页面底部
3. 节点(标签)查找方法与遍历方法
for循环迭代遍历
四、网络爬虫程序设计
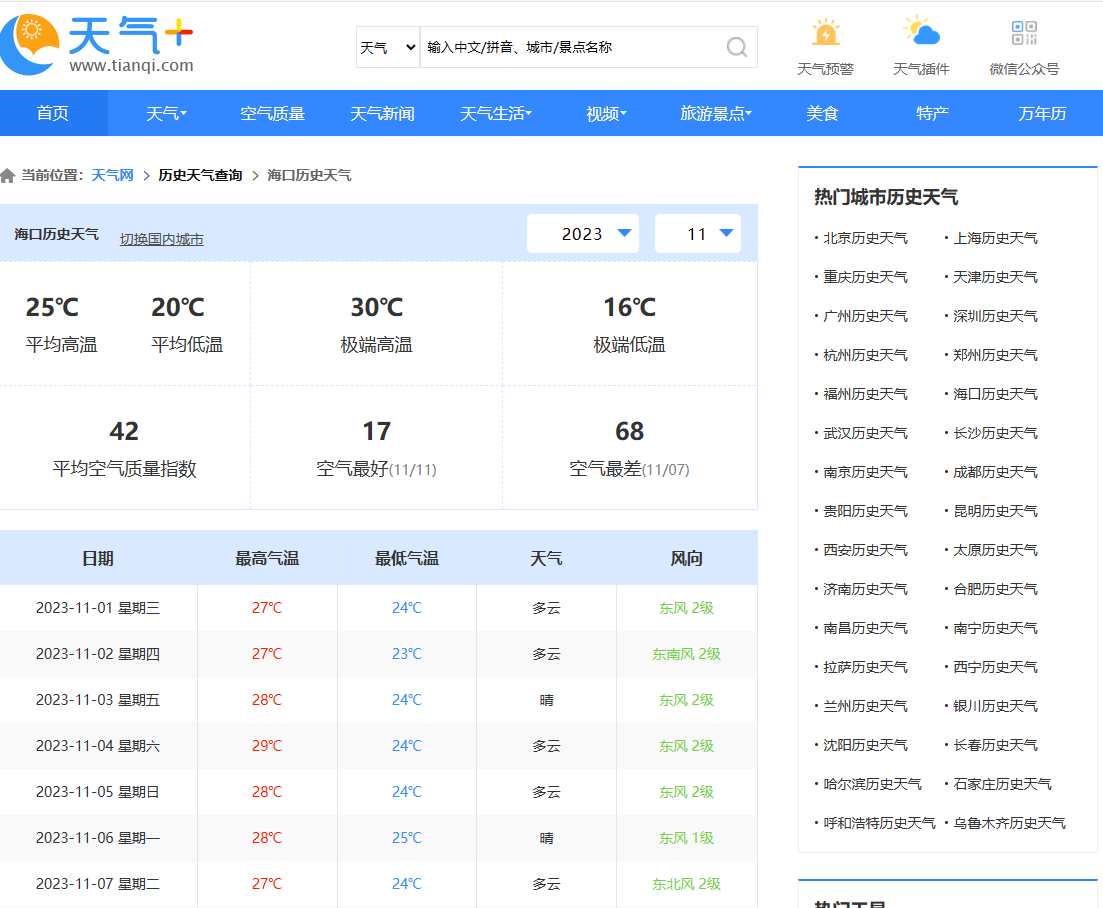
数据来源:查看天气网:http://www.tianqi.com.cn。访问海口市的历史天气网址:https://lishi.tianqi.com/haikou/202311.html,利用Python的爬虫技术从网站上爬取东莞市2023-11月历史天气数据信息。
Part1: 爬取天气网历海口史天气数据并保存未:"海口历史天气【2023年11月】.xls"文件

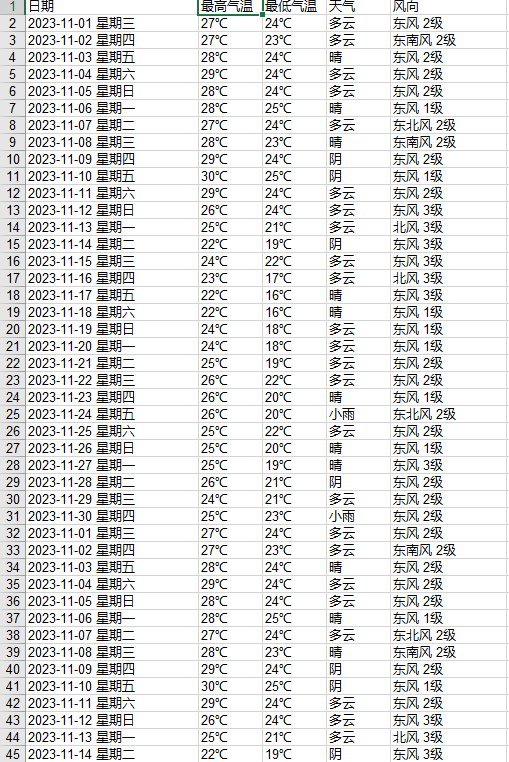
  1 import requests
  2 from lxml import etree
  3 import xlrd, xlwt, os
  4 from xlutils.copy import copy
  5
  6 class TianQi():
  7     def __init__(self):
  8         pass
  9
 10     #爬虫部分
 11     def spider(self):
 12         city_dict = {
 13             "海口": "haikou"
 14 }
 15         city = '海口'
 16         city = city_dict[f'{city}']
 17         year = '2023'
 18         month = '11'
 19         start_url = f'https://lishi.tianqi.com/{city}/{year}{month}.html'
 20         headers = {
 21             'authority': 'lishi.tianqi.com',
 22             'accept': 'text/html,application/xhtml+xml,application/xml;q=0.9,image/avif,image/webp,image/apng,*/*;q=0.8,application/signed-exchange;v=b3;q=0.7',
 23             'accept-language': 'zh-CN,zh;q=0.9',
 24             'cache-control': 'no-cache',
 25             # Requests sorts cookies= alphabetically
 26             'cookie': 'Hm_lvt_7c50c7060f1f743bccf8c150a646e90a=1701184759; Hm_lvt_30606b57e40fddacb2c26d2b789efbcb=1701184793; Hm_lpvt_30606b57e40fddacb2c26d2b789efbcb=1701184932; Hm_lpvt_7c50c7060f1f743bccf8c150a646e90a=1701185017',
 27             'pragma': 'no-cache',
 28             'referer': 'https://lishi.tianqi.com/ankang/202309.html',
 29             'sec-ch-ua': '"Google Chrome";v="119", "Chromium";v="119", "Not?A_Brand";v="24"',
 30             'sec-ch-ua-mobile': '?0',
 31             'sec-ch-ua-platform': '"Windows"',
 32             'sec-fetch-dest': 'document',
 33             'sec-fetch-mode': 'navigate',
 34             'sec-fetch-site': 'same-origin',
 35             'sec-fetch-user': '?1',
 36             'upgrade-insecure-requests': '1',
 37             'user-agent': 'Mozilla/5.0 (Windows NT 10.0; Win64; x64) AppleWebKit/537.36 (KHTML, like Gecko) Chrome/119.0.0.0 Safari/537.36',
 38         }
 39         response = requests.get(start_url,headers=headers).text
 40         tree = etree.HTML(response)
 41         datas = tree.xpath("/html/body/div[@class='main clearfix']/div[@class='main_left inleft']/div[@class='tian_three']/ul[@class='thrui']/li")
 42         weizhi = tree.xpath("/html/body/div[@class='main clearfix']/div[@class='main_left inleft']/div[@class='inleft_tian']/div[@class='tian_one']/div[@class='flex'][1]/h3/text()")[0]
 43         self.parase(datas,weizhi,year,month)
 44
 45
 46    #解析部分
 47     def parase(self,datas,weizhi,year,month):
 48         for data in datas:
 49             #1、日期
 50             datetime = data.xpath("./div[@class='th200']/text()")[0]
 51             #2、最高气温
 52             max_qiwen = data.xpath("./div[@class='th140'][1]/text()")[0]
 53             #3、最低气温
 54             min_qiwen = data.xpath("./div[@class='th140'][2]/text()")[0]
 55             #4、天气
 56             tianqi = data.xpath("./div[@class='th140'][3]/text()")[0]
 57             #5、风向
 58             fengxiang = data.xpath("./div[@class='th140'][4]/text()")[0]
 59             dict_tianqi = {
 60                 '日期':datetime,
 61                 '最高气温':max_qiwen,
 62                 '最低气温':min_qiwen,
 63                 '天气':tianqi,
 64                 '风向':fengxiang
 65             }
 66             data_excel = {
 67                 f'{weizhi}【{year}年{month}月】':[datetime,max_qiwen,min_qiwen,tianqi,fengxiang]
 68             }
 69             self.chucun_excel(data_excel,weizhi,year,month)
 70             print(dict_tianqi)
 71
 72
 73    #储存部分
 74     def chucun_excel(self, data,weizhi,year,month):
 75         if not os.path.exists(f'{weizhi}【{year}年{month}月】.xls'):
 76             # 1、创建 Excel 文件
 77             wb = xlwt.Workbook(encoding='utf-8')
 78             # 2、创建新的 Sheet 表
 79             sheet = wb.add_sheet(f'{weizhi}【{year}年{month}月】', cell_overwrite_ok=True)
 80             # 3、设置 Borders边框样式
 81             borders = xlwt.Borders()
 82             borders.left = xlwt.Borders.THIN
 83             borders.right = xlwt.Borders.THIN
 84             borders.top = xlwt.Borders.THIN
 85             borders.bottom = xlwt.Borders.THIN
 86             borders.left_colour = 0x40
 87             borders.right_colour = 0x40
 88             borders.top_colour = 0x40
 89             borders.bottom_colour = 0x40
 90             style = xlwt.XFStyle()  # Create Style
 91             style.borders = borders  # Add Borders to Style
 92             # 4、写入时居中设置
 93             align = xlwt.Alignment()
 94             align.horz = 0x02  # 水平居中
 95             align.vert = 0x01  # 垂直居中
 96             style.alignment = align
 97             # 5、设置表头信息, 遍历写入数据, 保存数据
 98             header = (
 99                 '日期', '最高气温', '最低气温', '天气', '风向')
100             for i in range(0, len(header)):
101                 sheet.col(i).width = 2560 * 3
102                 #行,列, 内容,   样式
103                 sheet.write(0, i, header[i], style)
104                 wb.save(f'{weizhi}【{year}年{month}月】.xls')
105         # 判断工作表是否存在
106         if os.path.exists(f'{weizhi}【{year}年{month}月】.xls'):
107             # 打开工作薄
108             wb = xlrd.open_workbook(f'{weizhi}【{year}年{month}月】.xls')
109             # 获取工作薄中所有表的个数
110             sheets = wb.sheet_names()
111             for i in range(len(sheets)):
112                 for name in data.keys():
113                     worksheet = wb.sheet_by_name(sheets[i])
114                     # 获取工作薄中所有表中的表名与数据名对比
115                     if worksheet.name == name:
116                         # 获取表中已存在的行数
117                         rows_old = worksheet.nrows
118                         # 将xlrd对象拷贝转化为xlwt对象
119                         new_workbook = copy(wb)
120                         # 获取转化后的工作薄中的第i张表
121                         new_worksheet = new_workbook.get_sheet(i)

122                         for num in range(0, len(data[name])):
123                             new_worksheet.write(rows_old, num, data[name][num])
124                         new_workbook.save(f'{weizhi}【{year}年{month}月】.xls')
125
126 if __name__ == '__main__':
127     t=TianQi()
128     t.spider()
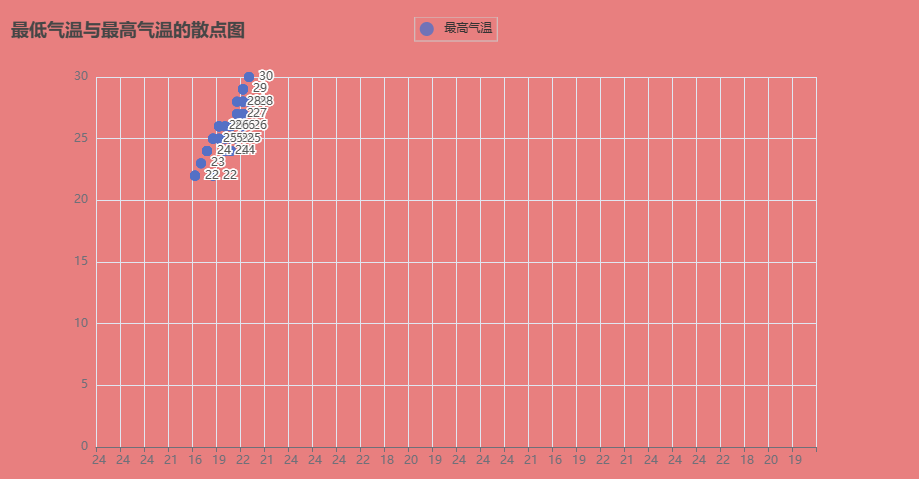
Part2:根据海口历史天气【2023年11月】.xls生成最低最高气温的散点图
 1 import pandas as pd
 2 import jieba
 3 from pyecharts.charts import Scatter
 4 from pyecharts import options as opts
 5
 6 from scipy import stats
 7
 8 # 读取数据
 9 df = pd.read_excel('海口历史天气【2023年11月】.xls')
10
11 # 使用 jieba 处理数据,去除 "C"
12 df['最高气温'] = df['最高气温'].apply(lambda x: ''.join(jieba.cut(x))).str.replace('℃', '').astype(float)
13 df['最低气温'] = df['最低气温'].apply(lambda x: ''.join(jieba.cut(x))).str.replace('℃', '').astype(float)
14
15 # 创建散点图
16 scatter = Scatter()
17 scatter.add_xaxis(df['最低气温'].tolist())
18 scatter.add_yaxis("最高气温", df['最高气温'].tolist())
19 scatter.set_global_opts(title_opts=opts.TitleOpts(title="最低气温与最高气温的散点图"))
20 html_content = scatter.render_embed()
21
22 # 计算回归方程
23 slope, intercept, r_value, p_value, std_err = stats.linregress(df['最低气温'], df['最高气温'])
24
25 print(f"回归方程为:y = {slope}x + {intercept}")
26
27 analysis_text = f"回归方程为:y = {slope}x + {intercept}"
28 # 生成HTML文件
29 complete_html = f"""
30 <html>
31 <head>
32     <title>天气数据分析</title>
33 </head>
34 <body style="background-color: #e87f7f">
35     <div style='margin-top: 20px;background-color='#e87f7f''>
36         <div>{html_content}</div>
37         <p>{analysis_text}</p>
38     </div>
39 </body>
40 </html>
41 """
42 # 保存到HTML文件
43 with open("海口历史天气【2023年11月】散点可视化.html", "w", encoding="utf-8") as file:
44     file.write(complete_html)
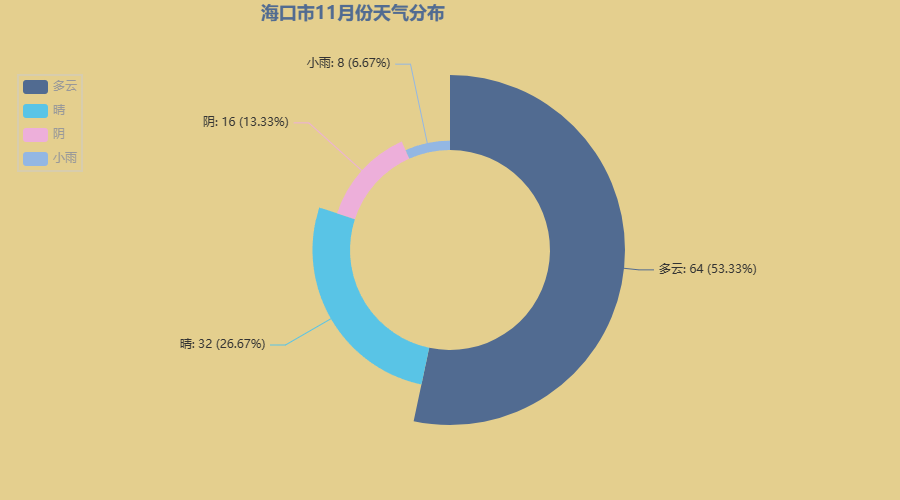
Part3:根据海口历史天气【2023年11月】.xls生成海口市天气分布图
 1 import pandas as pd
 2 from pyecharts.charts import Pie
 3 from pyecharts import options as opts
 4 from pyecharts.globals import ThemeType
 5
 6 def on(gender_counts):
 7     total = gender_counts.sum()
 8     percentages = {gender: count / total * 100 for gender, count in gender_counts.items()}
 9     analysis_parts = []
10     for gender, percentage in percentages.items():
11         analysis_parts.append(f"{gender}天气占比为{percentage:.2f}%,")
12     analysis_report = "天气比例饼状图显示," + ''.join(analysis_parts)
13     return analysis_report
14
15 df = pd.read_excel("海口历史天气【2023年11月】.xls")
16 gender_counts = df['天气'].value_counts()
17 analysis_text = on(gender_counts)
18 pie = Pie(init_opts=opts.InitOpts(theme=ThemeType.WESTEROS,bg_color='#e4cf8e'))
19
20 pie.add(
21     series_name="海口市天气分布",
22     data_pair=[list(z) for z in zip(gender_counts.index.tolist(), gender_counts.values.tolist())],
23     radius=["40%", "70%"],
24     rosetype="radius",
25     label_opts=opts.LabelOpts(is_show=True, position="outside", font_size=14,
26                               formatter="{a}<br/>{b}: {c} ({d}%)")
27 )
28 pie.set_global_opts(
29     title_opts=opts.TitleOpts(title="海口市11月份天气分布",pos_right="50%"),
30     legend_opts=opts.LegendOpts(orient="vertical", pos_top="15%", pos_left="2%"),
31     toolbox_opts=opts.ToolboxOpts(is_show=True)
32 )
33 pie.set_series_opts(label_opts=opts.LabelOpts(formatter="{b}: {c} ({d}%)"))
34 html_content = pie.render_embed()
35
36 # 生成HTML文件
37 complete_html = f"""
38 <html>
39 <head>
40     <title>天气数据分析</title>
41
42 </head>
43 <body style="background-color: #e87f7f">
44     <div style='margin-top: 20px;background-color='#e87f7f''>
45         <div>{html_content}</div>
46         <h3>分析报告:</h3>
47         <p>{analysis_text}</p>
48     </div>
49 </body>
50 </html>
51 """

52 # 保存到HTML文件
53 with open("海口历史天气【2023年11月】饼图可视化.html", "w", encoding="utf-8") as file:
54     file.write(complete_html)
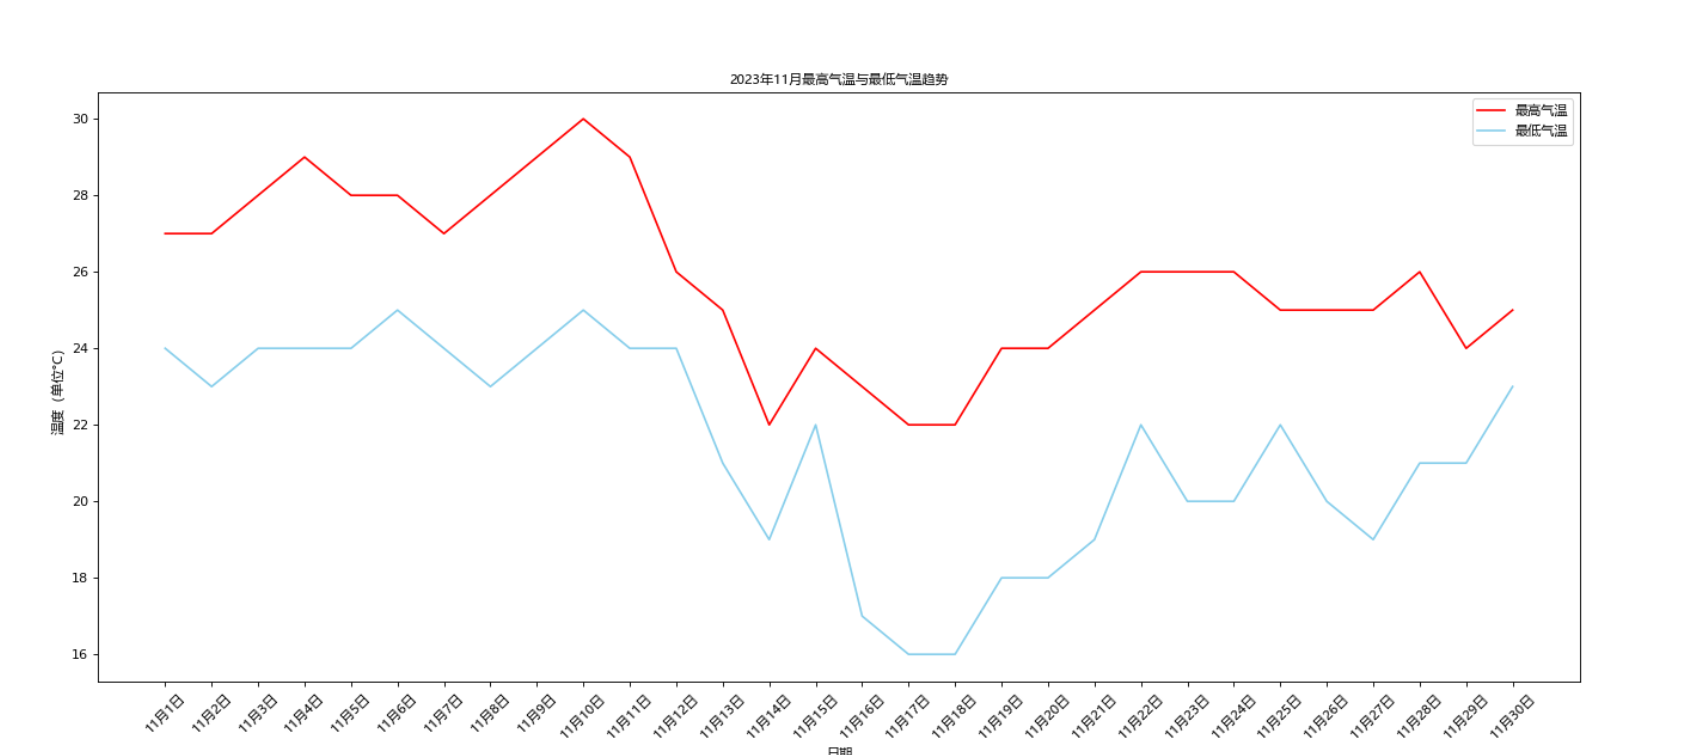
Part4:根据海口历史天气【2023年11月】.xls生成海口市温度趋势
 1 import pandas as pd
 2 import matplotlib.pyplot as plt
 3 from matplotlib import font_manager
 4 import jieba
 5
 6 # 中文字体
 7 font_CN = font_manager.FontProperties(fname="C:\Windows\Fonts\STKAITI.TTF")
 8
 9 # 读取数据
10 df = pd.read_excel('海口历史天气【2023年11月】.xls')
11
12 # 使用 jieba 处理数据,去除 "C"
13 df['最高气温'] = df['最高气温'].apply(lambda x: ''.join(jieba.cut(x))).str.replace('℃', '').astype(float)
14 df['最低气温'] = df['最低气温'].apply(lambda x: ''.join(jieba.cut(x))).str.replace('℃', '').astype(float)
15 # 开始绘图
16 plt.figure(figsize=(20, 8), dpi=80)
17 max_tp = df['最高气温'].tolist()
18 min_tp = df['最低气温'].tolist()
19 x_day = range(1, 31)
20 # 绘制30天最高气温
21 plt.plot(x_day, max_tp, label = "最高气温", color = "red")
22 # 绘制30天最低气温
23 plt.plot(x_day, min_tp, label = "最低气温", color = "skyblue")
24 # 增加x轴刻度
25 _xtick_label = ["11月{}日".format(i) for i in x_day]
26 plt.xticks(x_day, _xtick_label, fontproperties=font_CN, rotation=45)
27 # 添加标题
28 plt.title("2023年11月最高气温与最低气温趋势", fontproperties=font_CN)
29 plt.xlabel("日期", fontproperties=font_CN)
30 plt.ylabel("温度(单位°C)", fontproperties=font_CN)
31 plt.legend(prop = font_CN)
32 plt.show()
Part5:根据海口历史天气【2023年11月】.xls生成海口市词汇图

 1 from pyecharts.charts import WordCloud
 2 from pyecharts import options as opts
 3 from pyecharts.globals import SymbolType
 4 import jieba
 5 import pandas as pd
 6 from collections import Counter
 7
 8 # 读取Excel文件
 9 df = pd.read_excel('海口历史天气【2023年11月】.xls')
10 # 提取商品名
11 word_names = df["风向"].tolist() + df["天气"].tolist()
12 # 提取关键字
13 seg_list = [jieba.lcut(text) for text in word_names]
14 words = [word for seg in seg_list for word in seg if len(word) > 1]
15 word_counts = Counter(words)
16 word_cloud_data = [(word, count) for word, count in word_counts.items()]
17
18 # 创建词云图
19 wordcloud = (
20     WordCloud(init_opts=opts.InitOpts(bg_color='#00FFFF'))
21         .add("", word_cloud_data, word_size_range=[20, 100], shape=SymbolType.DIAMOND,
22              word_gap=5, rotate_step=45,
23              textstyle_opts=opts.TextStyleOpts(font_family='cursive', font_size=15))
24         .set_global_opts(title_opts=opts.TitleOpts(title="天气预报词云图",pos_top="5%", pos_left="center"),
25                          toolbox_opts=opts.ToolboxOpts(
26                              is_show=True,
27                              feature={
28                                  "saveAsImage": {},
29                                  "dataView": {},
30                                  "restore": {},
31                                  "refresh": {}
32                              }
33                          )
34
35     )
36 )
37
38 # 渲染词图到HTML文件
39 wordcloud.render("天气预报词云图.html")
爬虫课程设计全部代码如下:
  1 import requests
  2 from lxml import etree
  3 import xlrd, xlwt, os
  4 from xlutils.copy import copy
  5
  6 class TianQi():
  7     def __init__(self):
  8         pass
  9
 10     #爬虫部分
 11     def spider(self):
 12         city_dict = {
 13             "海口": "haikou"
 14 }
 15         city = '海口'
 16         city = city_dict[f'{city}']
 17         year = '2023'
 18         month = '11'
 19         start_url = f'https://lishi.tianqi.com/{city}/{year}{month}.html'
 20         headers = {
 21             'authority': 'lishi.tianqi.com',
 22             'accept': 'text/html,application/xhtml+xml,application/xml;q=0.9,image/avif,image/webp,image/apng,*/*;q=0.8,application/signed-exchange;v=b3;q=0.7',
 23             'accept-language': 'zh-CN,zh;q=0.9',
 24             'cache-control': 'no-cache',
 25             # Requests sorts cookies= alphabetically
 26             'cookie': 'Hm_lvt_7c50c7060f1f743bccf8c150a646e90a=1701184759; Hm_lvt_30606b57e40fddacb2c26d2b789efbcb=1701184793; Hm_lpvt_30606b57e40fddacb2c26d2b789efbcb=1701184932; Hm_lpvt_7c50c7060f1f743bccf8c150a646e90a=1701185017',
 27             'pragma': 'no-cache',
 28             'referer': 'https://lishi.tianqi.com/ankang/202309.html',
 29             'sec-ch-ua': '"Google Chrome";v="119", "Chromium";v="119", "Not?A_Brand";v="24"',
 30             'sec-ch-ua-mobile': '?0',
 31             'sec-ch-ua-platform': '"Windows"',
 32             'sec-fetch-dest': 'document',
 33             'sec-fetch-mode': 'navigate',
 34             'sec-fetch-site': 'same-origin',
 35             'sec-fetch-user': '?1',
 36             'upgrade-insecure-requests': '1',
 37             'user-agent': 'Mozilla/5.0 (Windows NT 10.0; Win64; x64) AppleWebKit/537.36 (KHTML, like Gecko) Chrome/119.0.0.0 Safari/537.36',
 38         }
 39         response = requests.get(start_url,headers=headers).text
 40         tree = etree.HTML(response)
 41         datas = tree.xpath("/html/body/div[@class='main clearfix']/div[@class='main_left inleft']/div[@class='tian_three']/ul[@class='thrui']/li")
 42         weizhi = tree.xpath("/html/body/div[@class='main clearfix']/div[@class='main_left inleft']/div[@class='inleft_tian']/div[@class='tian_one']/div[@class='flex'][1]/h3/text()")[0]
 43         self.parase(datas,weizhi,year,month)
 44
 45
 46    #解析部分
 47     def parase(self,datas,weizhi,year,month):
 48         for data in datas:
 49             #1、日期
 50             datetime = data.xpath("./div[@class='th200']/text()")[0]
 51             #2、最高气温
 52             max_qiwen = data.xpath("./div[@class='th140'][1]/text()")[0]
 53             #3、最低气温
 54             min_qiwen = data.xpath("./div[@class='th140'][2]/text()")[0]
 55             #4、天气
 56             tianqi = data.xpath("./div[@class='th140'][3]/text()")[0]
 57             #5、风向
 58             fengxiang = data.xpath("./div[@class='th140'][4]/text()")[0]
 59             dict_tianqi = {
 60                 '日期':datetime,
 61                 '最高气温':max_qiwen,
 62                 '最低气温':min_qiwen,
 63                 '天气':tianqi,
 64                 '风向':fengxiang
 65             }
 66             data_excel = {
 67                 f'{weizhi}【{year}年{month}月】':[datetime,max_qiwen,min_qiwen,tianqi,fengxiang]
 68             }
 69             self.chucun_excel(data_excel,weizhi,year,month)
 70             print(dict_tianqi)
 71
 72
 73    #储存部分
 74     def chucun_excel(self, data,weizhi,year,month):
 75         if not os.path.exists(f'{weizhi}【{year}年{month}月】.xls'):
 76             # 1、创建 Excel 文件
 77             wb = xlwt.Workbook(encoding='utf-8')
 78             # 2、创建新的 Sheet 表
 79             sheet = wb.add_sheet(f'{weizhi}【{year}年{month}月】', cell_overwrite_ok=True)
 80             # 3、设置 Borders边框样式
 81             borders = xlwt.Borders()
 82             borders.left = xlwt.Borders.THIN
 83             borders.right = xlwt.Borders.THIN
 84             borders.top = xlwt.Borders.THIN
 85             borders.bottom = xlwt.Borders.THIN
 86             borders.left_colour = 0x40
 87             borders.right_colour = 0x40
 88             borders.top_colour = 0x40
 89             borders.bottom_colour = 0x40
 90             style = xlwt.XFStyle()  # Create Style
 91             style.borders = borders  # Add Borders to Style
 92             # 4、写入时居中设置
 93             align = xlwt.Alignment()
 94             align.horz = 0x02  # 水平居中
 95             align.vert = 0x01  # 垂直居中
 96             style.alignment = align
 97             # 5、设置表头信息, 遍历写入数据, 保存数据
 98             header = (
 99                 '日期', '最高气温', '最低气温', '天气', '风向')
100             for i in range(0, len(header)):
101                 sheet.col(i).width = 2560 * 3
102                 #           行,列, 内容,   样式
103                 sheet.write(0, i, header[i], style)
104                 wb.save(f'{weizhi}【{year}年{month}月】.xls')
105         # 判断工作表是否存在
106         if os.path.exists(f'{weizhi}【{year}年{month}月】.xls'):
107             # 打开工作薄
108             wb = xlrd.open_workbook(f'{weizhi}【{year}年{month}月】.xls')
109             # 获取工作薄中所有表的个数
110             sheets = wb.sheet_names()
111             for i in range(len(sheets)):
112                 for name in data.keys():
113                     worksheet = wb.sheet_by_name(sheets[i])
114                     # 获取工作薄中所有表中的表名与数据名对比
115                     if worksheet.name == name:
116                         # 获取表中已存在的行数
117                         rows_old = worksheet.nrows
118                         # 将xlrd对象拷贝转化为xlwt对象
119                         new_workbook = copy(wb)
120                         # 获取转化后的工作薄中的第i张表
121                         new_worksheet = new_workbook.get_sheet(i)
122                         for num in range(0, len(data[name])):
123                             new_worksheet.write(rows_old, num, data[name][num])
124                         new_workbook.save(f'{weizhi}【{year}年{month}月】.xls')
125
126 if __name__ == '__main__':
127     t=TianQi()
128     t.spider()
129 import pandas as pd
130 import jieba
131 from pyecharts.charts import Scatter
132 from pyecharts import options as opts
133
134 from scipy import stats
135
136 # 读取数据
137 df = pd.read_excel('海口历史天气【2023年11月】.xls')
138
139 # 使用 jieba 处理数据,去除 "C"
140 df['最高气温'] = df['最高气温'].apply(lambda x: ''.join(jieba.cut(x))).str.replace('℃', '').astype(float)
141 df['最低气温'] = df['最低气温'].apply(lambda x: ''.join(jieba.cut(x))).str.replace('℃', '').astype(float)
142
143 # 创建散点图
144 scatter = Scatter()
145 scatter.add_xaxis(df['最低气温'].tolist())
146 scatter.add_yaxis("最高气温", df['最高气温'].tolist())
147 scatter.set_global_opts(title_opts=opts.TitleOpts(title="最低气温与最高气温的散点图"))
148 html_content = scatter.render_embed()
149
150 # 计算回归方程
151 slope, intercept, r_value, p_value, std_err = stats.linregress(df['最低气温'], df['最高气温'])
152
153 print(f"回归方程为:y = {slope}x + {intercept}")
154
155 analysis_text = f"回归方程为:y = {slope}x + {intercept}"
156 # 生成HTML文件
157 complete_html = f"""
158 <html>
159 <head>
160     <title>天气数据分析</title>
161 </head>
162 <body style="background-color: #e87f7f">
163     <div style='margin-top: 20px;background-color='#e87f7f''>
164         <div>{html_content}</div>
165         <p>{analysis_text}</p>
166     </div>
167 </body>
168 </html>
169 """
170 # 保存到HTML文件
171 with open("海口历史天气【2023年11月】散点可视化.html", "w", encoding="utf-8") as file:
172     file.write(complete_html)
173
174 import pandas as pd
175 from flatbuffers.builder import np
176 from matplotlib import pyplot as plt
177 from pyecharts.charts import Pie
178 from pyecharts import options as opts
179 from pyecharts.globals import ThemeType
180
181 def on(gender_counts):
182     total = gender_counts.sum()
183     percentages = {gender: count / total * 100 for gender, count in gender_counts.items()}
184     analysis_parts = []
185     for gender, percentage in percentages.items():
186         analysis_parts.append(f"{gender}天气占比为{percentage:.2f}%,")
187     analysis_report = "天气比例饼状图显示," + ''.join(analysis_parts)
188     return analysis_report
189
190 df = pd.read_excel("海口历史天气【2023年11月】.xls")
191 gender_counts = df['天气'].value_counts()
192 analysis_text = on(gender_counts)
193 pie = Pie(init_opts=opts.InitOpts(theme=ThemeType.WESTEROS,bg_color='#e4cf8e'))
194 pie.add(
195     series_name="海口市天气分布",
196     data_pair=[list(z) for z in zip(gender_counts.index.tolist(), gender_counts.values.tolist())],
197     radius=["40%", "70%"],
198     rosetype="radius",
199     label_opts=opts.LabelOpts(is_show=True, position="outside", font_size=14,
200                               formatter="{a}<br/>{b}: {c} ({d}%)")
201 )
202 pie.set_global_opts(
203     title_opts=opts.TitleOpts(title="海口市11月份天气分布",pos_right="50%"),
204     legend_opts=opts.LegendOpts(orient="vertical", pos_top="15%", pos_left="2%"),
205     toolbox_opts=opts.ToolboxOpts(is_show=True)
206 )
207 pie.set_series_opts(label_opts=opts.LabelOpts(formatter="{b}: {c} ({d}%)"))
208 html_content = pie.render_embed()
209
210 # 生成HTML文件
211 complete_html = f"""
212 <html>
213 <head>
214     <title>天气数据分析</title>
215
216 </head>
217 <body style="background-color: #e87f7f">
218     <div style='margin-top: 20px;background-color='#e87f7f''>
219         <div>{html_content}</div>
220         <h3>分析报告:</h3>
221         <p>{analysis_text}</p>
222     </div>
223 </body>
224 </html>
225 """
226
227 import pandas as pd
228 import matplotlib.pyplot as plt
229 from matplotlib import font_manager
230 import jieba
231
232 # 中文字体
233 font_CN = font_manager.FontProperties(fname="C:\Windows\Fonts\STKAITI.TTF")
234
235 # 读取数据
236 df = pd.read_excel('海口历史天气【2023年11月】.xls')
237
238 # 使用 jieba 处理数据,去除 "C"
239 df['最高气温'] = df['最高气温'].apply(lambda x: ''.join(jieba.cut(x))).str.replace('℃', '').astype(float)
240 df['最低气温'] = df['最低气温'].apply(lambda x: ''.join(jieba.cut(x))).str.replace('℃', '').astype(float)
241 # 开始绘图
242 plt.figure(figsize=(20, 8), dpi=80)
243 max_tp = df['最高气温'].tolist()
244 min_tp = df['最低气温'].tolist()
245 x_day = range(1, 31)
246 # 绘制30天最高气温
247 plt.plot(x_day, max_tp, label = "最高气温", color = "red")
248 # 绘制30天最低气温
249 plt.plot(x_day, min_tp, label = "最低气温", color = "skyblue")
250 # 增加x轴刻度
251 _xtick_label = ["11月{}日".format(i) for i in x_day]
252 plt.xticks(x_day, _xtick_label, fontproperties=font_CN, rotation=45)
253 # 添加标题
254 plt.title("2023年11月最高气温与最低气温趋势", fontproperties=font_CN)
255 plt.xlabel("日期", fontproperties=font_CN)
256 plt.ylabel("温度(单位°C)", fontproperties=font_CN)
257 plt.legend(prop = font_CN)
258 plt.show()
259
260 from pyecharts.charts import WordCloud
261 from pyecharts import options as opts
262 from pyecharts.globals import SymbolType
263 import jieba
264 import pandas as pd
265 from collections import Counter
266
267 # 读取Excel文件
268 df = pd.read_excel('海口历史天气【2023年11月】.xls')
269 # 提取商品名
270 word_names = df["风向"].tolist() + df["天气"].tolist()
271 # 提取关键字
272 seg_list = [jieba.lcut(text) for text in word_names]
273 words = [word for seg in seg_list for word in seg if len(word) > 1]
274 word_counts = Counter(words)
275 word_cloud_data = [(word, count) for word, count in word_counts.items()]
276
277 # 创建词云图
278 wordcloud = (
279     WordCloud(init_opts=opts.InitOpts(bg_color='#00FFFF'))
280         .add("", word_cloud_data, word_size_range=[20, 100], shape=SymbolType.DIAMOND,
281              word_gap=5, rotate_step=45,
282              textstyle_opts=opts.TextStyleOpts(font_family='cursive', font_size=15))
283         .set_global_opts(title_opts=opts.TitleOpts(title="天气预报词云图",pos_top="5%", pos_left="center"),
284                          toolbox_opts=opts.ToolboxOpts(
285                              is_show=True,
286                              feature={
287                                  "saveAsImage": {},
288                                  "dataView": {},
289                                  "restore": {},
290                                  "refresh": {}
291                              }
292                          )
293
294     )
295 )
296
297 # 渲染词图到HTML文件
298 wordcloud.render("天气预报词云图.html")
五、总结
1.根据散点图的显示回归方:y = 0.6988742964352719x + 10.877423389618516来获取海口市11月份温度趋势
2.根据饼状图可以了解海口市11月份的天气比例,多云天气占比为53.33%,晴天气占比为26.67%,阴天气占比为13.33%,小雨天气占比为6.67%,
3.根据折线图了解海口市11月份的最高温度和最低温度趋势。
4.根据词云图的显示,可以了解当月的天气质量相关内容。
综述:是通过Python爬虫技术获取天气预报数据,数据爬取方面,通过Python编写爬虫程序,利用网络爬虫技术从天气网站上获取天气预报数据,并进行数据清洗和处理。数据可视化方面,利用数据可视化工具,将存储的数据进行可视化展示,以便用户更直观地了解天气情况因此用户更好地理解和应用天气数据,从而做出更准确的决策和规划。