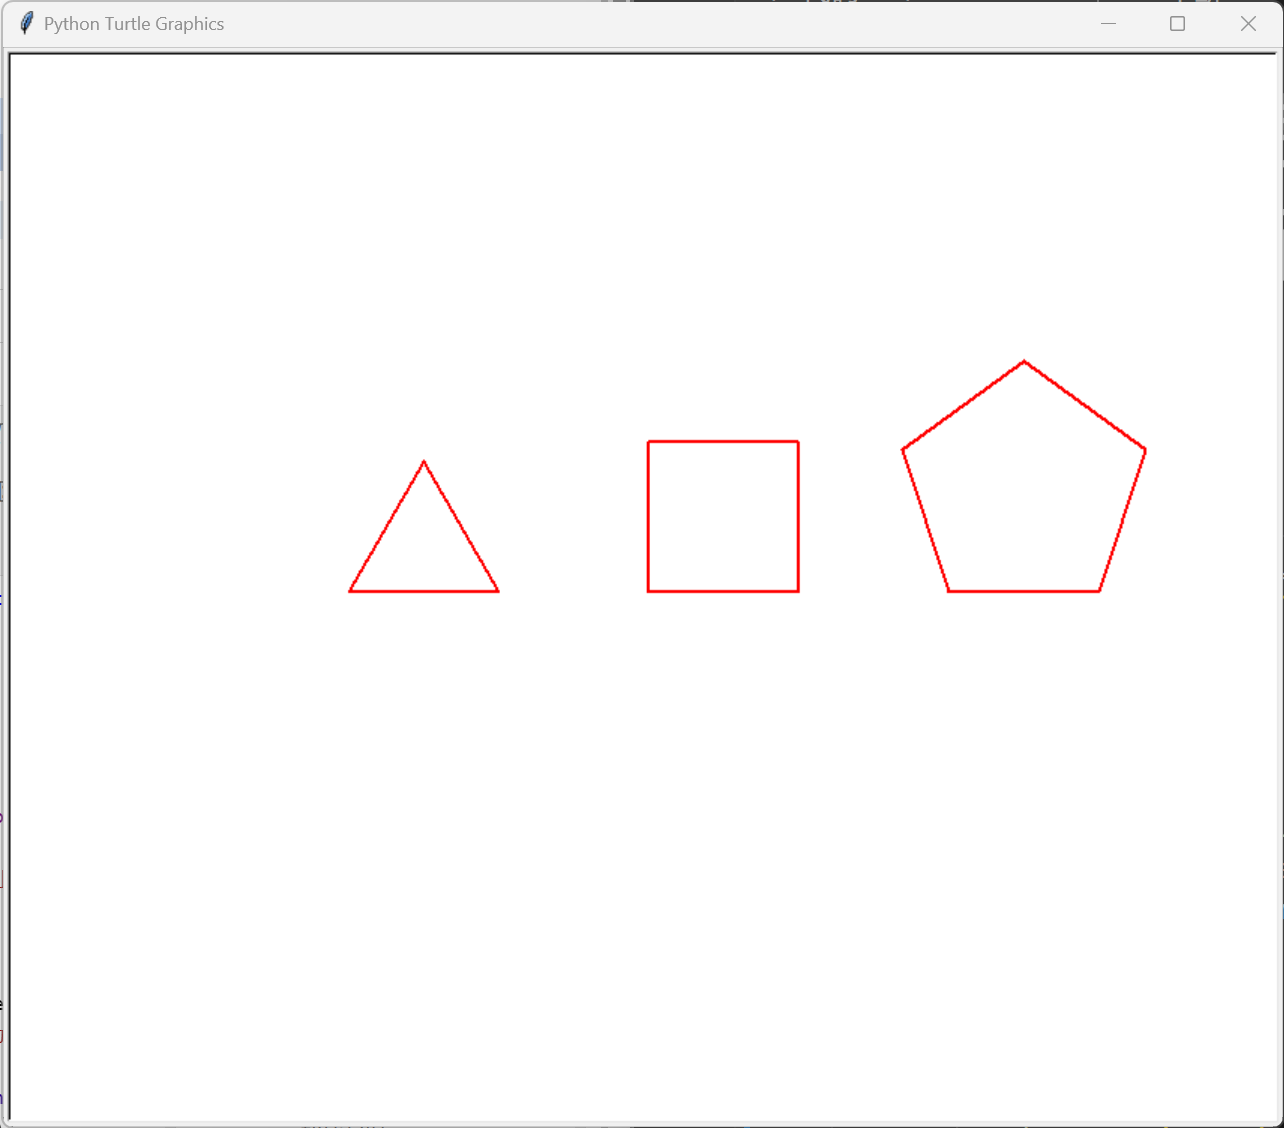
实验任务1:使用turtle绘制基础图形(验证性)
task1_1.py
from turtle import *
def move(x, y):
    '''画笔移动到坐标(x,y)处'''
    penup()
    goto(x, y)
    pendown()
def draw(n, size = 100):
    '''绘制边长为size的正n变形'''
    for i in range(n):
        fd(size)
        left(360/n)
def main():
    pensize(2)
    pencolor('red')
    move(-200, 0)
    draw(3)
    move(0, 0)
    draw(4)
    move(200, 0)
    draw(5)
    hideturtle()
    done()
main()
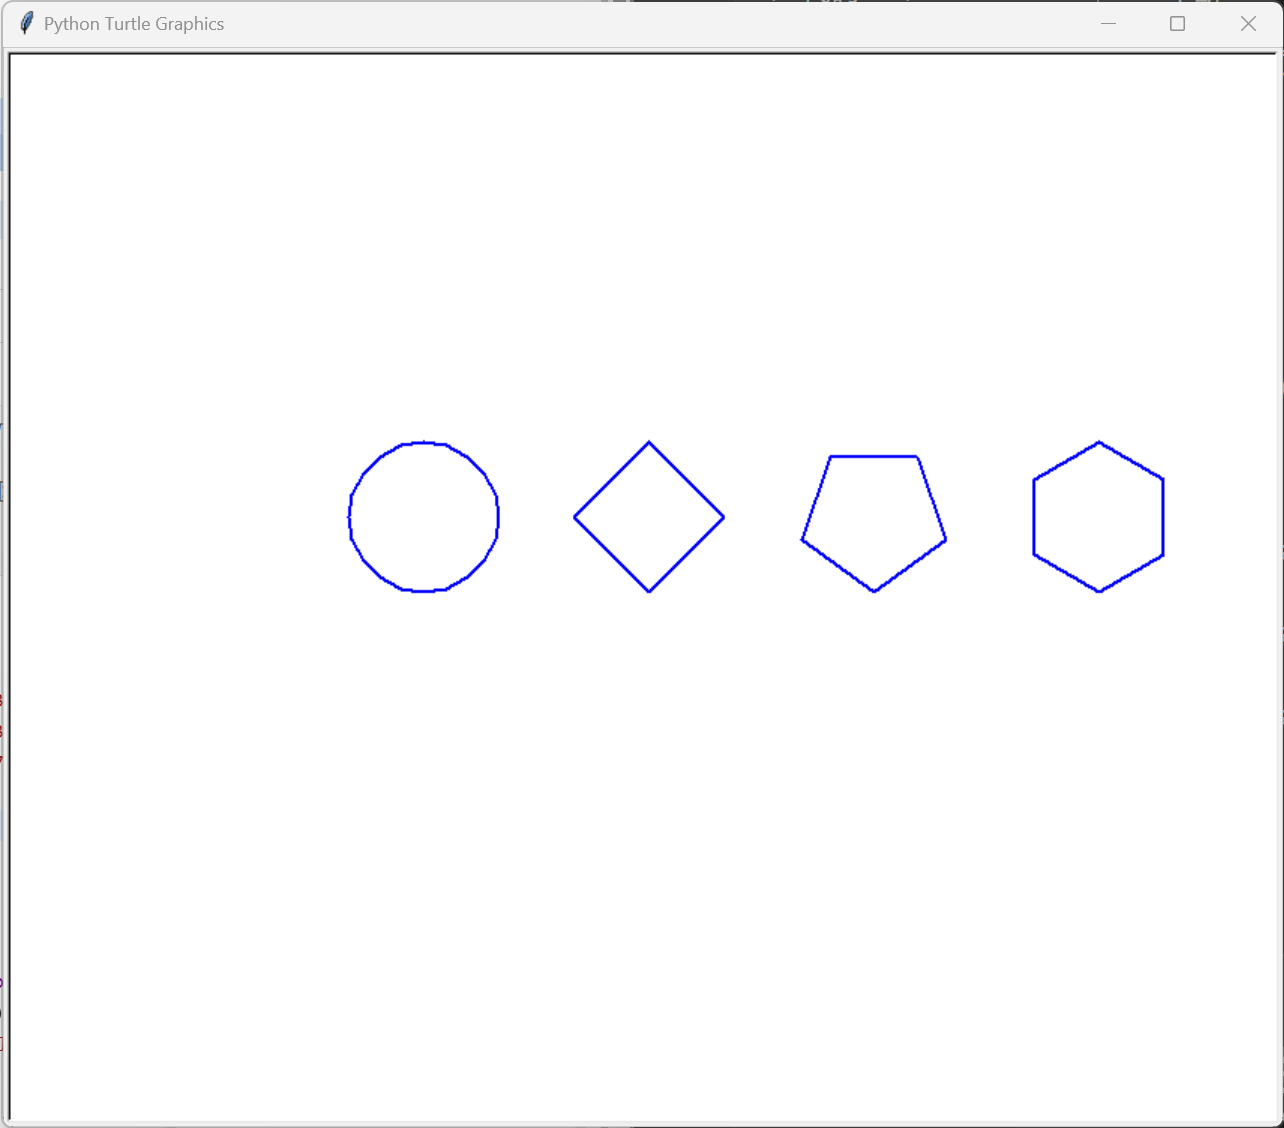
task1_2.py
from turtle import *
def moveto(x, y):
    '''把画笔移动至坐标(x, y)处'''
    penup()
    goto(x, y)
    pendown()
def main():
    pensize(2)
    pencolor('blue')
    moveto(-150, 0)
    circle(50)
    moveto(0, 0)
    circle(50, steps = 4)
    moveto(150, 0)
    circle(50, steps = 5)
    moveto(300, 0)
    circle(50, steps = 6)
    hideturtle()
    done()
main()
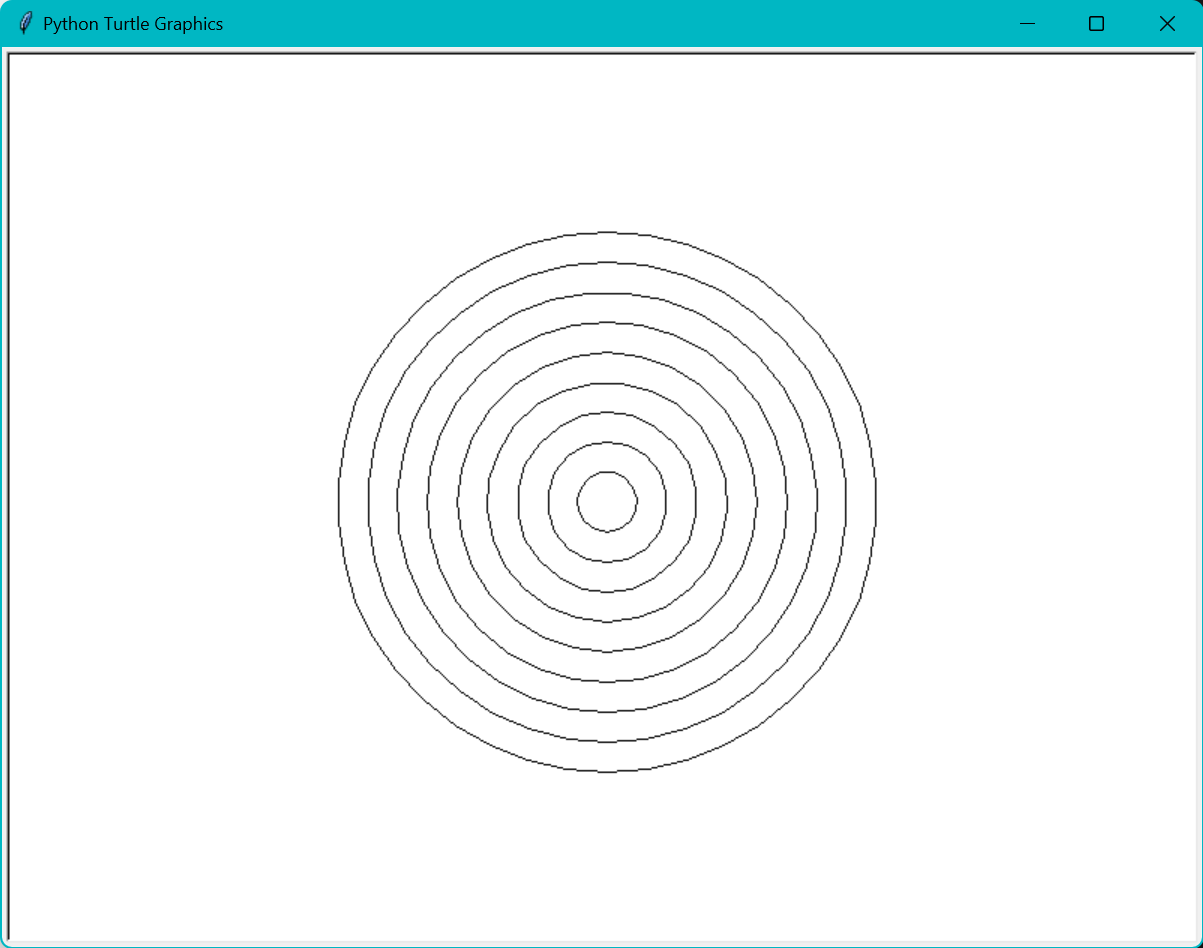
实验任务2:使用turtle绘制9个同心圆 (验证性)
task2_1.py
'''以(0,0)为圆心,绘制9个同心圆'''
from turtle import *
def moveto(x, y):
    '''把画笔移至坐标(x,y)处'''
    penup()
    goto(x, y)
    pendown()
def main():
    setup(800, 600)
    radius = 20 # 圆初始半径
    offset = 20 # 同心圆每次位移量
    for i in range(9):
        moveto(0, -radius)
        circle(radius)
        radius += offset
    hideturtle()
    done()
main()
task2_2.py
'''以(0, 0)为圆心,绘制9个彩色同心圆,色彩随机生成'''
from turtle import *
from random import random
def moveto(x, y):
    '''把画笔移至坐标(x,y)处'''
    penup()
    goto(x, y)
    pendown()
def gen_color():
    '''生成一个以rgb三元组表示的颜色值并返回'''
    return tuple((random() for i in range(3)))
def main():
    setup(800, 600)
    radius = 180 # 圆初始半径
    offset = 20 # 同心圆每次位移量
    for i in range(8):
        moveto(0, -radius)
        color(gen_color())
        begin_fill()
        circle(radius)
        end_fill()
        radius -= offset
    hideturtle()
    done()
main()
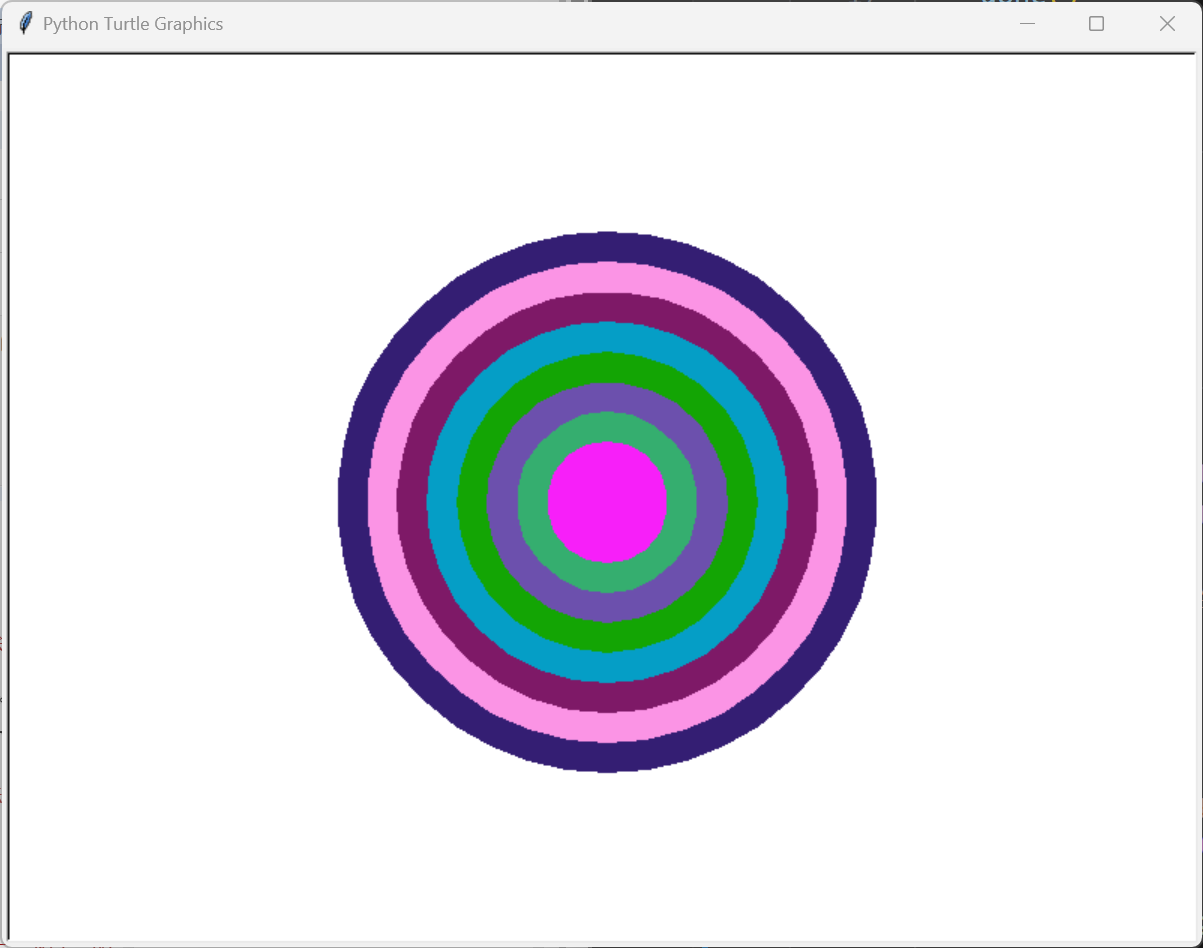
这个代码实现中,绘制同心圆是按照半径从大到小绘制的。如果绘制同心圆时,半径从小到大绘
制,能否实现题目要求?请修改代码尝试验证。
不能,大圆会把小圆覆盖
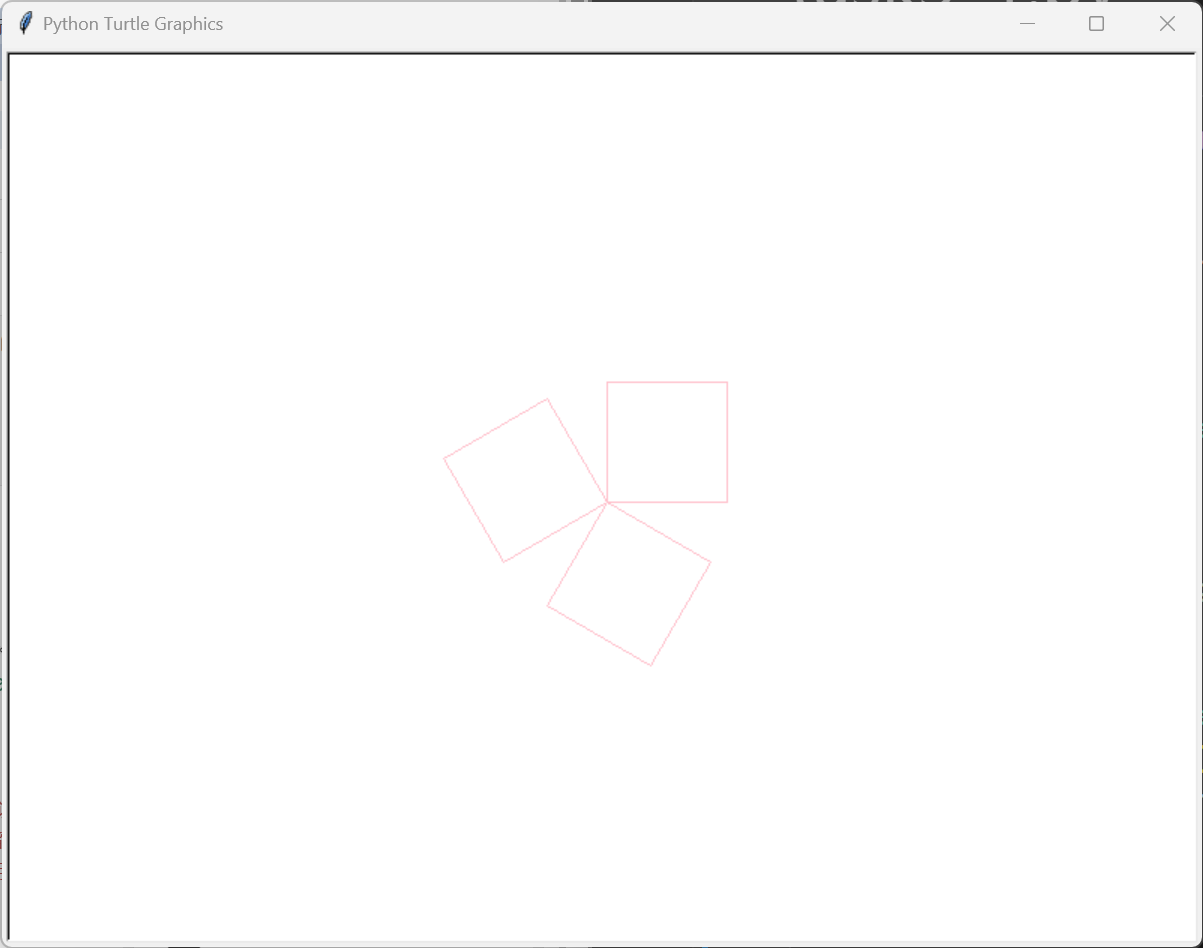
实验任务3:使用turtle绘制花瓣效果
task3_1.py
from turtle import *
def square(size = 50, rgb = 'pink'):
    '''绘制正方形
    :para: size:int 指定边长 (如未指定参数,使用默认值)
    :para: c: str 指定画笔颜色值 (如未指定参数,使用默认值)
    '''
    pencolor(rgb)
    for i in range(4):
        fd(size)
        left(90)
def main():
    setup(800, 600)
    speed(0)
    n = 3
    for i in range(n):
        square(80)
        left(360/n)
    hideturtle()
    done()
main()
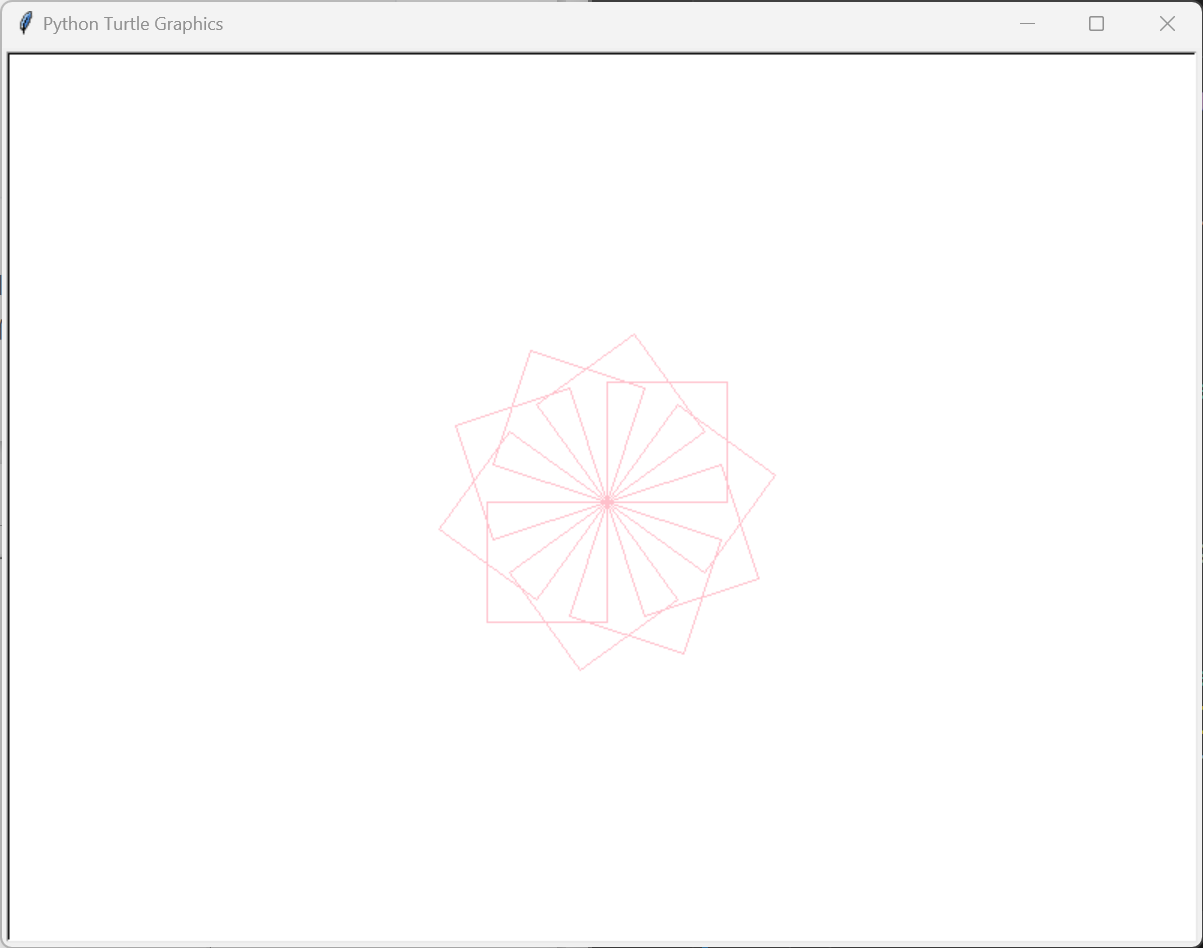
修改后:
from turtle import *
def square(size = 50, rgb = 'pink'):
    '''绘制正方形
    :para: size:int 指定边长 (如未指定参数,使用默认值)
    :para: c: str 指定画笔颜色值 (如未指定参数,使用默认值)
    '''
    pencolor(rgb)
    for i in range(4):
        fd(size)
        left(90)
def main():
    setup(800, 600)
    speed(0)
    n = 10
    for i in range(n):
        square(80)
        left(360/n)
    hideturtle()
    done()
main()
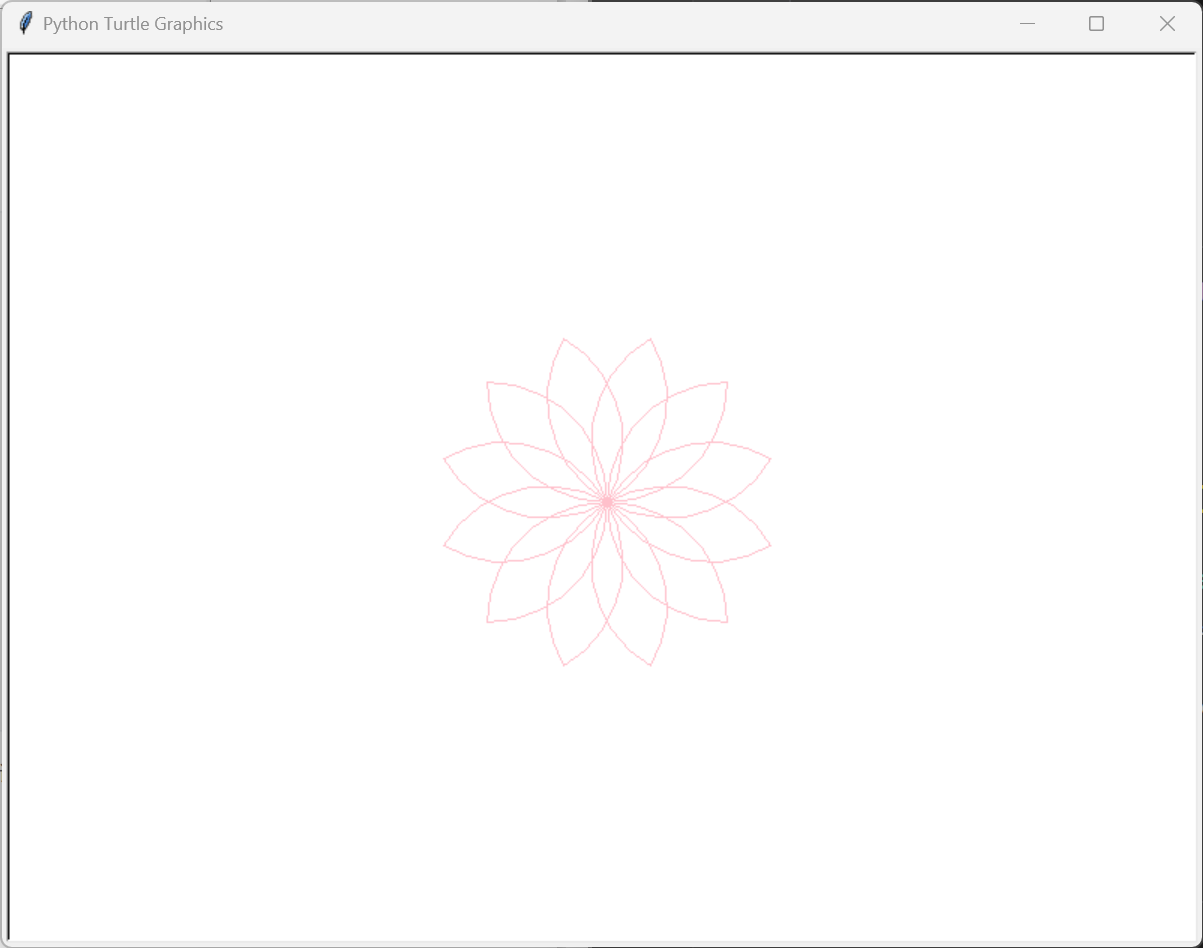
task3_2.py
from turtle import *
setup(800, 600)
pencolor('pink')
n = 4
speed(0)
for i in range(12):
    # 绘制一片花瓣
    for j in range(2):
        circle(80,90)
        left(180)
        right(360/n)
    left(30)
hideturtle()
done()
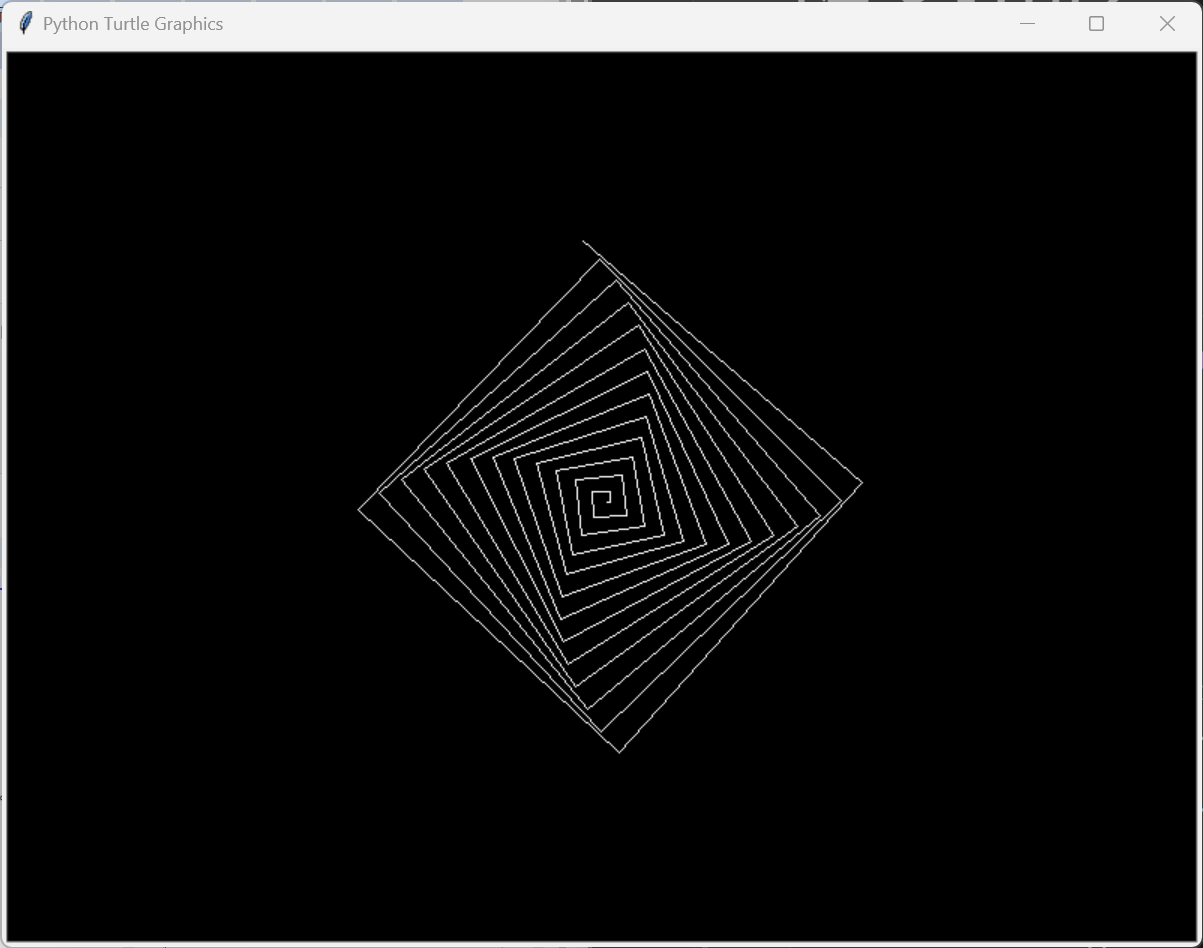
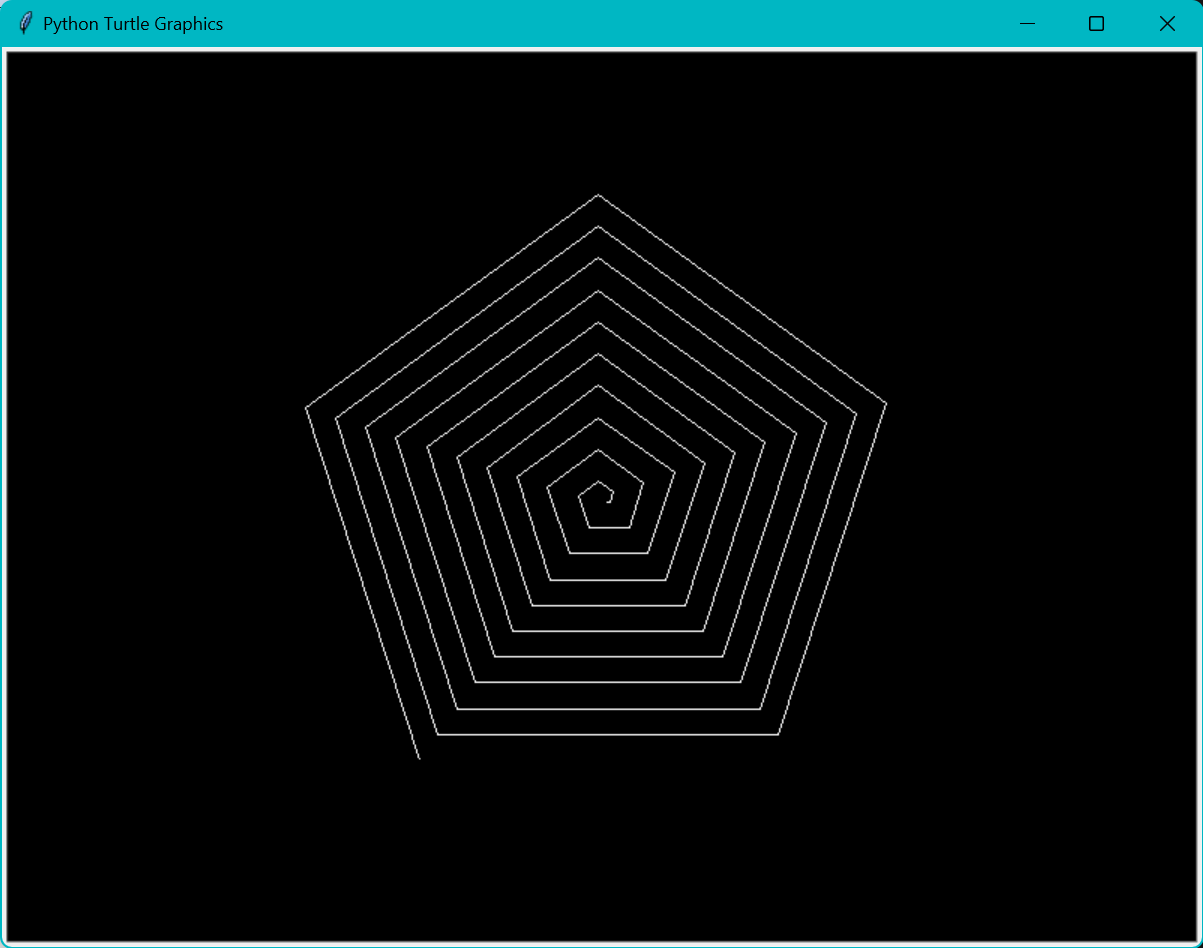
实验任务4:使用turtle绘制螺旋多边形
task4.py
from turtle import *
setup(800, 600)
bgcolor('black')
pencolor('white')
speed(0)
angle = 0
size = 2
n = 4 # 螺旋n边形
count = 50 # 循环次数
for i in range(count):
    fd(size)
    angle += 360/n + 1
    seth(angle)
    size += 5
hideturtle()
done()
修改后:
from turtle import *
setup(800, 600)
bgcolor('black')
pencolor('white')
speed(0)
angle = 0
size = 2
n = 5 # 螺旋n边形
count = 50 # 循环次数
for i in range(count):
    fd(size)
    angle += 360/n
    seth(angle)

    size += 5
hideturtle()
done()
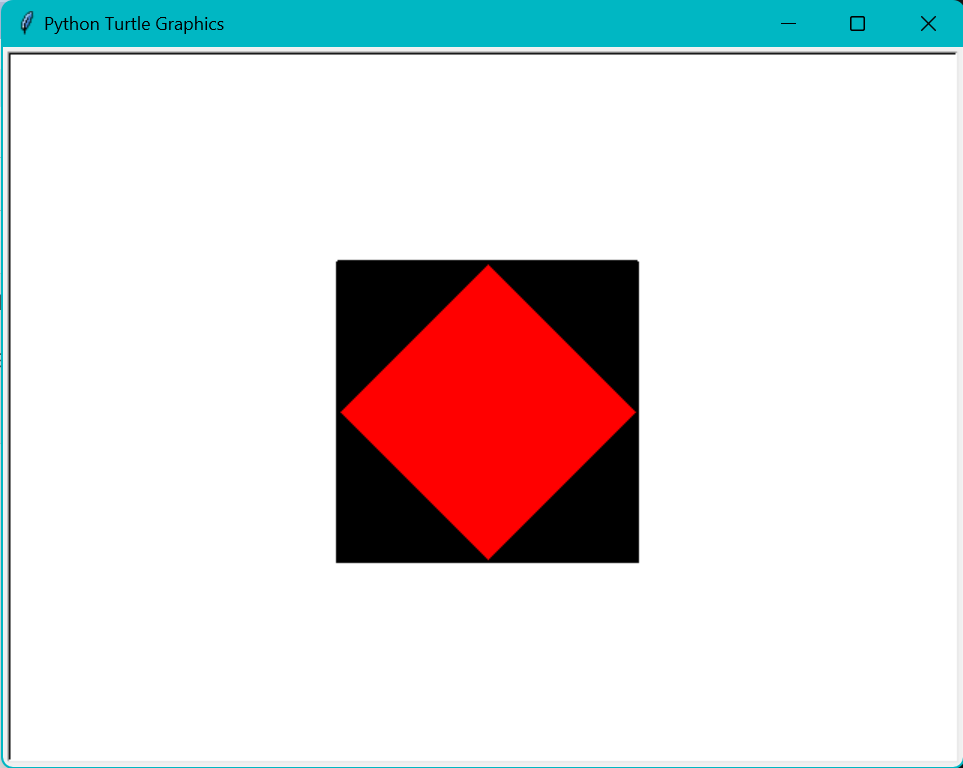
实验任务5:使用turtle绘制基础图形
task5_1.py
from turtle import *
import math
def moveto(x,y):
    penup()
    goto(x,y)
    pendown()

def draw(n,color,size=100):
    fillcolor(color)
    begin_fill()

    angle=0
    for i in range(n):
        fd(size)
        angle=360/n
        left(angle)
    end_fill()


setup(640,480,500,200)
pensize(2)
#bgcolor('black')

moveto(-100,-100)
draw(4,'black',size=200)

moveto(0,-100)
seth(45)
draw(4,'red',size=100*math.sqrt(2))
hideturtle()

done()
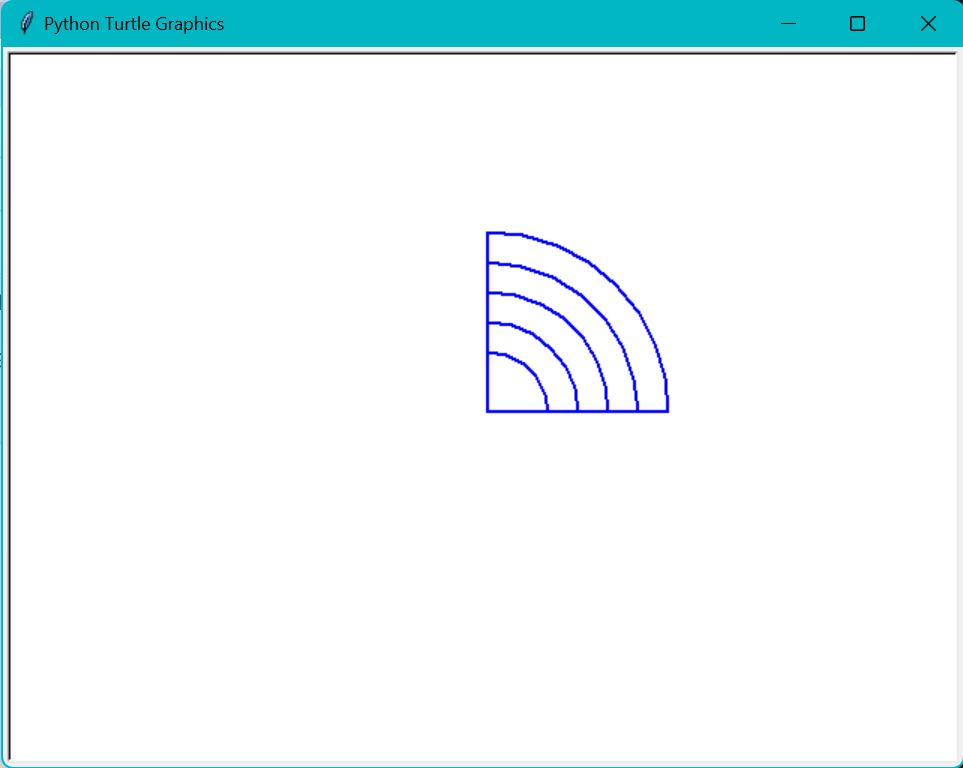
task5_2.py
from turtle import *
import math
def moveto(x,y):
    penup()
    goto(x,y)
    pendown()

setup(640,480,500,200)
pensize(2)
pencolor('blue')

r=40
fd(r+4*20)
moveto(0,0)
seth(90)
fd(r+4*20)
moveto(r,0)
seth(90)
for i in range(5):
    circle(r+i*20,90)
    moveto(r+(i+1)*20,0)
    seth(90)
hideturtle()


done()
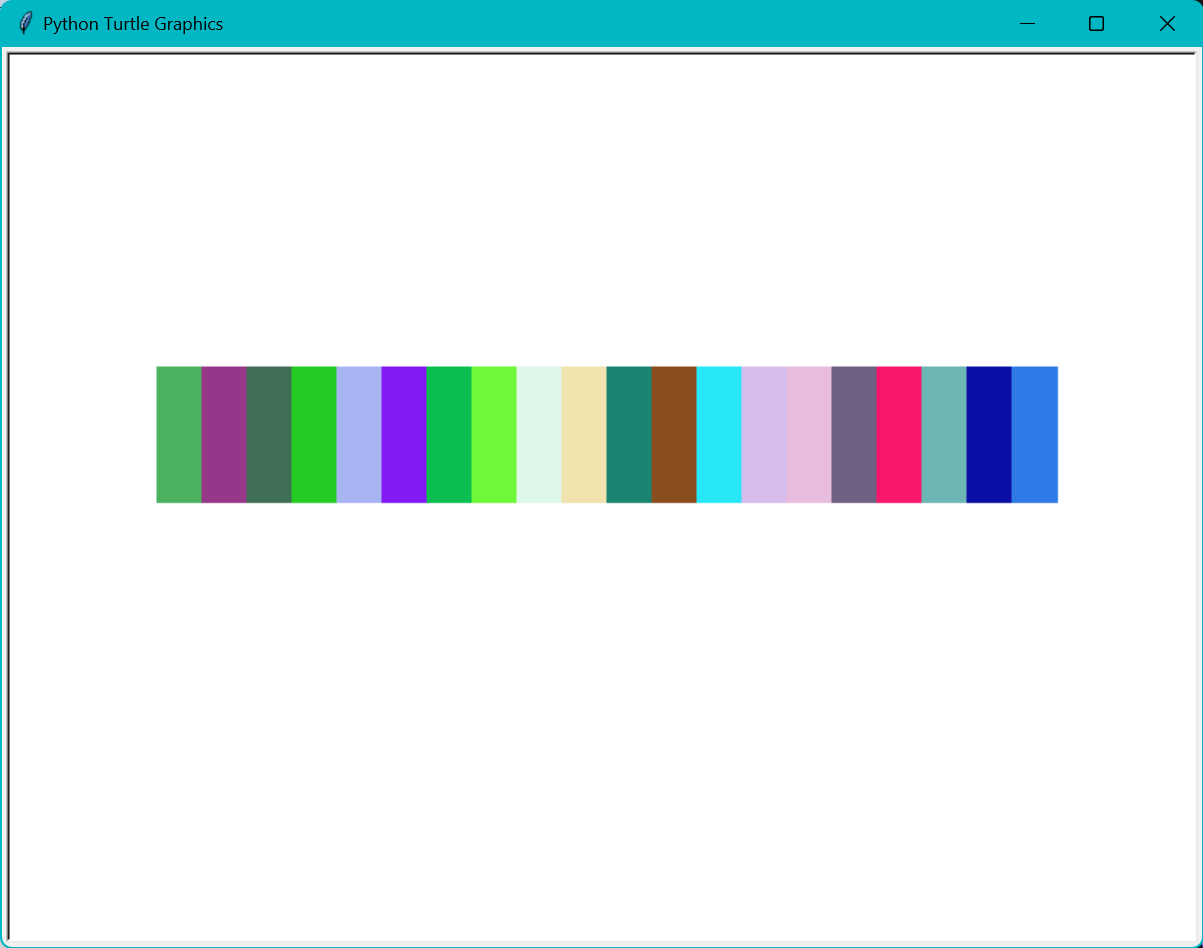
实验任务6:二者选一绘图任务(彩色图谱/吃豆人)
from turtle import *
from random import random
def moveto(x, y):
    '''把画笔移至坐标(x,y)处'''
    penup()
    goto(x, y)
    pendown()
def gen_color():
    '''生成一个以rgb三元组表示的颜色值并返回'''
    return tuple((random() for i in range(3)))
def rect(l,w):
    t=gen_color()
    pencolor(t)
    pensize(0)
    fillcolor(t)
    begin_fill()
    fd(l)
    left(90)
    fd(w)
    left(90)
    fd(l)
    left(90)
    fd(w)
    left(90)
    end_fill()
def main():
    setup(800, 600)
    speed(0)
    l=30
    w=90
    moveto(-l*10,0)
    for i in range(1,21):
        rect(l,w)
        moveto(-l*(10-i),0)
    hideturtle()
    done()

main()
实验任务7:使用matplotlib库可视化数据模型处理结果
import matplotlib.pyplot as plt

def func(x):
    return r*x*(1-x)

def gen_list(x,n):
    result=[]
    for i in range(n):
        t=func(x)
        result.append(t)
        x=t
    return result

r = 4
n = 30

# 调用函数并获取结果
x1 = gen_list(0.2,n)

x2 = gen_list(0.20000001,n)


# 打印结果列表
print(f'results1:{x1}')
print(f'results2:{x2}')

# 绘制折线图
plt.plot(list(range(1,n+1)),x1,'o-',label='x1')
plt.plot(list(range(1,n+1)),x2,'s-',label='x2')
plt.xticks(list(range(0,n+1,5)))
plt.xlabel('Iteration')
plt.ylabel('Value')
plt.title('Logistic Map')
plt.legend(['x1=0.2','x2=0.20000001'])
plt.show()

实验任务8:从中文文本生成词云
import jieba
from wordcloud import WordCloud # 从wordcloud模块导入词云类WordCloud
from matplotlib import pyplot as plt

text = '''requests是一个常用的HTTP请求库,可以方便地向网站发送HTTP请求,并获取响应结果。
Scrapy是一个开源和协作框架,用于从网站中提取数据,是最流行的爬虫框架。
SciPy是一个开源的Python算法库和数学工具包,它基于Numpy,用于数学、科学、工程学等领域。'''

word = jieba.lcut(text) # 使用jieba模块的函数lcut()对中文文本进行精确分词

t = ' '.join(word)
t_wc = WordCloud(font_path = 'msyh.ttc').generate(t) # 创建WordCloud对象,使用其方法generate()生成词云
t_wc.to_file('wordcloud.png') # 保存词云图片

plt.imshow(t_wc) # 在屏幕上显示词云
plt.axis('off')
plt.show()
