1、准备仓库
1.1、配置prometheus仓库
1.1.1、增加prometheus仓库
helm repo add prometheus-community https://prometheus-community.github.io/helm-charts
1.1.2、查询增加的结果
]# helm repo list
NAME                    URL
bitnami                 https://charts.bitnami.com/bitnami
prometheus-community    https://prometheus-community.github.io/helm-charts
1.2、查询prometheus
1.2.1、查询prometheus社区版
]# helm search repo prometheus-community
NAME                                                    CHART VERSION   APP VERSION     DESCRIPTION
prometheus-community/alertmanager                       0.28.0          v0.25.0         The Alertmanager handles alerts sent by client ...
prometheus-community/alertmanager-snmp-notifier         0.1.0           v1.4.0          The SNMP Notifier handles alerts coming from Pr...
prometheus-community/jiralert                           1.2.0           v1.3.0          A Helm chart for Kubernetes to install jiralert
prometheus-community/kube-prometheus-stack              45.9.1          v0.63.0         kube-prometheus-stack collects Kubernetes manif...
prometheus-community/kube-state-metrics                 5.4.0           2.8.2           Install kube-state-metrics to generate and expo...
prometheus-community/prom-label-proxy                   0.2.0           v0.6.0          A proxy that enforces a given label in a given ...
prometheus-community/prometheus                         20.2.0          v2.43.0         Prometheus is a monitoring system and time seri...
...
2、Helm部署Promtheus
mkdir /opt/helm_prometheus && cd /opt/helm_prometheus/
2.2、helm安装prometheus
2.2.1、拉取prometheus-community/prometheus
helm pull prometheus-community/prometheus
2.2.2、解压文件
tar xvf prometheus-20.2.0.tgz && cd prometheus/
2.2.3、prometheus将镜像地址修改为本地仓库
prometheus]# grep -E 'repository|tag' values.yaml | grep -v '^.*#'
      repository: 192.168.10.33:80/k8s/prometheus-operator/prometheus-config-reloader
      tag: v0.63.0
    repository: 192.168.10.33:80/k8s/prometheus/prometheus
    tag: "v2.41.0"
2.2.4、修改子charts将镜像地址修改为本地仓库
# 修改alertmanager
prometheus]# cat charts/alertmanager/values.yaml | grep -E 'image:|repository|tag' | grep -v '^.*#'
image:
  repository: 192.168.10.33:80/k8s/prometheus/alertmanager
  tag: "v0.25.0"
  image:
    repository: 192.168.10.33:80/k8s/configmap-reload
    tag: v0.8.0

# 修改kube-state-metrics
prometheus]# cat charts/kube-state-metrics/values.yaml | grep -E 'image:|repository|tag' | grep -v '^.*#'
image:
  repository: 192.168.10.33:80/kube-state-metrics/kube-state-metrics
  tag: "v2.7.0"
  image:
    repository: 192.168.10.33:80/k8s/brancz/kube-rbac-proxy
    tag: v0.14.0

# 修改node_exporter
prometheus]# cat charts/prometheus-node-exporter/values.yaml | grep -E 'image:|repository|tag' | grep -v '^.*#'
image:
  repository: 192.168.10.33:80/k8s/prometheus/node-exporter
  tag: "v1.5.0"

# 修改prometheus-pushgateway
prometheus]# cat charts/prometheus-pushgateway/values.yaml | grep -E 'image:|repository|tag' | grep -v '^.*#'
image:
  repository: 192.168.10.33:80/k8s/pushgateway
  tag: "latest"
2.2.5、关闭持久化存储
# 主要用于演示,生产的话,必须要配置上sc
# alertmanager关闭持久化存储
]# vi charts/alertmanager/values.yaml
persistence:
  enabled: true

# prometheus关闭持久化存储
prometheus]# vi values.yaml
  # schedulerName:

  persistentVolume:
    ## If true, Prometheus server will create/use a Persistent Volume Claim
    ## If false, use emptyDir
    ##
    enabled: false
2.2.6、配置prometheus的ingress
prometheus]# vi values.yaml
  ingress:
    enabled: true
    annotations:
      kubernetes.io/ingress.class: nginx
    hosts:
      - prom.localprom.com
    path: /
    pathType: Prefix
2.2.7、配置alertmanager的ingress
prometheus]# vi charts/alertmanager/values.yaml
ingress:
  enabled: true
  className: ""
  annotations:
    kubernetes.io/ingress.class: nginx
  hosts:
    - host: alert.localprom.com
2.3、开始使用heml部署
2.3.1、创建命名空间
kubectl create ns monitoring
2.3.2、打包安装
release_pkg]# helm package /opt/helm_prometheus/prometheus/
Successfully packaged chart and saved it to: /opt/helm_prometheus/release_pkg/prometheus-20.2.0.tgz

release_pkg]# helm install my-prom prometheus-20.2.0.tgz --namespace monitoring
NAME: my-prom
LAST DEPLOYED: Thu Apr 13 21:25:38 2023
NAMESPACE: monitoring
STATUS: deployed
REVISION: 1
NOTES:
The Prometheus server can be accessed via port 80 on the following DNS name from within your cluster:
my-prom-prometheus-server.monitoring.svc.cluster.local


Get the Prometheus server URL by running these commands in the same shell:
  export POD_NAME=$(kubectl get pods --namespace monitoring -l "app=prometheus,component=server" -o jsonpath="{.items[0].metadata.name}")
  kubectl --namespace monitoring port-forward $POD_NAME 9090
#################################################################################
######   WARNING: Persistence is disabled!!! You will lose your data when   #####
######            the Server pod is terminated.                             #####
#################################################################################


The Prometheus alertmanager can be accessed via port  on the following DNS name from within your cluster:
my-prom-prometheus-%!s(<nil>).monitoring.svc.cluster.local


Get the Alertmanager URL by running these commands in the same shell:
  export POD_NAME=$(kubectl get pods --namespace monitoring -l "app=prometheus,component=" -o jsonpath="{.items[0].metadata.name}")
  kubectl --namespace monitoring port-forward $POD_NAME 9093
#################################################################################
######   WARNING: Persistence is disabled!!! You will lose your data when   #####
######            the AlertManager pod is terminated.                       #####
#################################################################################
#################################################################################
######   WARNING: Pod Security Policy has been disabled by default since    #####
######            it deprecated after k8s 1.25+. use                        #####
######            (index .Values "prometheus-node-exporter" "rbac"          #####
###### .          "pspEnabled") with (index .Values                         #####
######            "prometheus-node-exporter" "rbac" "pspAnnotations")       #####
######            in case you still need it.                                #####
#################################################################################


The Prometheus PushGateway can be accessed via port 9091 on the following DNS name from within your cluster:
my-prom-prometheus-pushgateway.monitoring.svc.cluster.local


Get the PushGateway URL by running these commands in the same shell:
  export POD_NAME=$(kubectl get pods --namespace monitoring -l "app=prometheus-pushgateway,component=pushgateway" -o jsonpath="{.items[0].metadata.name}")
  kubectl --namespace monitoring port-forward $POD_NAME 9091

For more information on running Prometheus, visit:
https://prometheus.io/
2.4、查询运行的状态
2.4.1、查询helm状态
]# helm -n monitoring list
NAME    NAMESPACE       REVISION        UPDATED                                 STATUS          CHART                   APP VERSION
my-prom monitoring      1               2023-04-14 00:14:02.704314691 +0800 CST deployed        prometheus-20.2.0       v2.43.0
2.4.2、查询运行pod状态
]# kubectl -n monitoring get pods -o wide
NAME                                             READY   STATUS    RESTARTS   AGE     IP              NODE      NOMINATED NODE   READINESS GATES
my-prom-alertmanager-0                           1/1     Running   0          3m48s   10.244.3.32     node1     <none>           <none>
my-prom-kube-state-metrics-578d99fccd-948jp      1/1     Running   0          3m48s   10.244.4.28     node2     <none>           <none>
my-prom-prometheus-node-exporter-fdzd9           1/1     Running   0          3m48s   192.168.10.26   master1   <none>           <none>
my-prom-prometheus-node-exporter-hmzv5           1/1     Running   0          3m48s   192.168.10.27   master2   <none>           <none>
my-prom-prometheus-node-exporter-pd4t8           1/1     Running   0          3m48s   192.168.10.29   node1     <none>           <none>
my-prom-prometheus-node-exporter-wbvr8           1/1     Running   0          3m48s   192.168.10.30   node2     <none>           <none>
my-prom-prometheus-pushgateway-d8f59f5cd-5czmf   1/1     Running   0          3m48s   10.244.4.27     node2     <none>           <none>
my-prom-prometheus-server-5f99d8b8c6-qkrjz       2/2     Running   0          3m48s   10.244.3.31     node1     <none>           <none>
2.4.3、查询ingress状态
]# kubectl -n monitoring get ingress
NAME                        CLASS    HOSTS                 ADDRESS         PORTS   AGE
my-prom-alertmanager        <none>   alert.localprom.com   192.168.10.29   80      4m18s
my-prom-prometheus-server   <none>   prom.localprom.com    192.168.10.29   80      4m18s
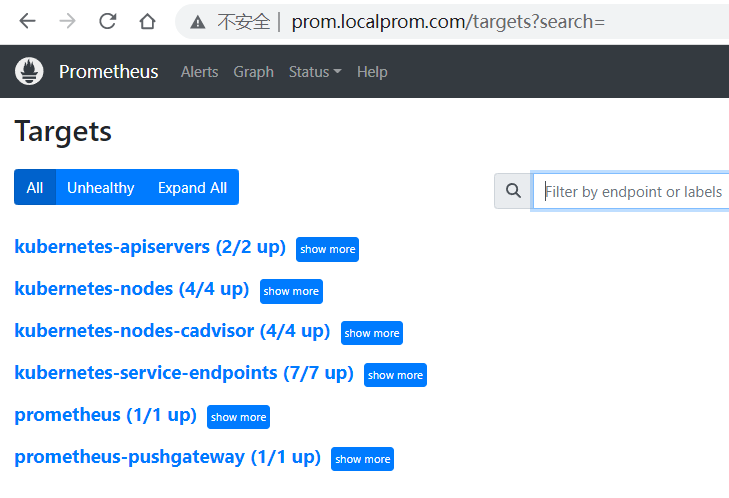
2.4.5、查询prometheus网页
2.4.6、查询alertmanager网页

3、Prometheus-persistentVolume-TSDB持久化问题解决
3.1、创建StorageClass资源
关于SC,请参考小节:https://www.cnblogs.com/ygbh/p/17319970.html

]# kubectl get sc
NAME     PROVISIONER                                   RECLAIMPOLICY   VOLUMEBINDINGMODE   ALLOWVOLUMEEXPANSION   AGE
nfs-sc   k8s-sigs.io/nfs-subdir-external-provisioner   Delete          Immediate           false                  75m
3.2、配置values.yaml
prometheus]# vi values.yaml
server:
  ### The data directory used by prometheus to set --storage.tsdb.path
  ### 主要设置prometheus数据库保存的数据
  storagePath: "/data"

  persistentVolume:
    accessModes:
      - ReadWriteMany
    mountPath: /data
    size: 8Gi
    storageClass: "nfs-sc"
3.3、打包安装
helm package /opt/helm_prometheus/prometheus/
helm install my-prom prometheus-20.2.0.tgz -n monitoring
3.4、查询运行的状态
3.4.1、helm运行状态
helm_prometheus]# helm  list
NAME    NAMESPACE       REVISION        UPDATED                                 STATUS          CHART                   APP VERSION
my-prom default         1               2023-04-15 00:21:09.252727402 +0800 CST deployed        prometheus-20.2.0       v2.43.0
3.4.2、查询pod运行状态
helm_prometheus]# kubectl get pod -n monitoring
NAME                                             READY   STATUS    RESTARTS   AGE
my-prom-alertmanager-0                           1/1     Running   0          8m10s
my-prom-kube-state-metrics-578d99fccd-x9m54      1/1     Running   0          8m10s
my-prom-prometheus-node-exporter-48m69           1/1     Running   0          8m10s
my-prom-prometheus-node-exporter-vbbcl           1/1     Running   0          8m10s
my-prom-prometheus-node-exporter-zmxzn           1/1     Running   0          8m10s
my-prom-prometheus-pushgateway-d8f59f5cd-krw9n   1/1     Running   0          8m10s
my-prom-prometheus-server-7cdb88d757-vbp7v       2/2     Running   0          8m10s
3.4.3、查询NFS目录数据
nfs-data]# tree
.
├── alertmanager_data
├── lost+found
└── promtheus_data
    └── default-my-prom-prometheus-server-pvc-d46dd959-fa69-4d97-a47b-17b6fd1a2c5d
        ├── chunks_head
        ├── lock
        ├── queries.active
        └── wal
            └── 00000000

6 directories, 3 files

# 说明数据已经写入NFS挂载点
3.5、删除helm分析数据是否持久化
3.5.1、删除prometheus helm
helm_prometheus]# helm -n monitoring uninstall my-prom
release "my-prom" uninstalled
3.5.2、查询NFS数据还是存在
nfs-data]# tree
.
├── alertmanager_data
├── lost+found
└── promtheus_data
    └── archived-monitoring-my-prom-prometheus-server-pvc-5faf5c4b-8493-4465-a9c0-2624f1096488
        ├── chunks_head
        ├── queries.active
        └── wal
            └── 00000000
# 数据还是存在
3.5.3、数据的删和留是由SC配置决定
我们当前StorageClass配置是如下:

archiveOnDelete: "ture"
reclaimPolicy: Delete

1、pod删除重建后数据依然存在,旧pod名称及数据依然保留给新pod使用
2、sc删除重建后数据依然存在,旧pod名称及数据依然保留给新pod使用
3、删除PVC后,PV不会别删除,且状态由Bound变为Released,NFS Server对应数据被保留
4、重建sc后,新建PVC会绑定新的pv,旧数据可以通过拷贝到新的PV中

可以参考小节-K8S-StorageClass资源-实践:https://www.cnblogs.com/ygbh/p/17319970.html#_label4