实验任务1
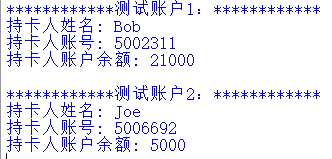
class Account:
    '''一个模拟银行账户的简单类'''

    def __init__(self, name, account_number, initial_amount = 10):
        '''构造新账户'''
        self._name = name
        self._card_no = account_number
        self._balance = initial_amount

    def deposit(self, amount):
        '''存款'''
        self._balance += amount

    def withdraw(self, amount):
        '''取款'''
        if self._balance < amount:
            print('余额不足')
            return

        self._balance -= amount

    def info(self):
        '''打印账户信息'''
        print('持卡人姓名:', self._name)
        print('持卡人账号:', self._card_no)
        print('持卡人账户余额:', self._balance)

    def get_balance(self):
        '''返回账户余额'''
        return self._balance

def main():
    '''创建Account类对象,测试类'''
    print('测试账户1:'.center(30, '*'))
    a1 = Account('Bob', '5002311', 20000)
    a1.deposit(5000)
    a1.withdraw(4000)
    a1.info()

    print()

    print('测试账户2:'.center(30, '*'))
    a2 = Account('Joe', '5006692', 20000)
    a2.withdraw(10000)
    a2.withdraw(5000)
    a2.info()

if __name__ == '__main__':
    main()
运行结果如图:
1.类:具有相似属性和特征事物的集合
对象:具有某项属性和特征的具体的一个事物,包括属性和行为
方法:在类中定义的函数
实例化:给抽象的属性赋值,使对象得以建立
2.封装性:在类内部将同一属性的东西放在一起,通过self.xxx来调用
实验任务2
shape.py
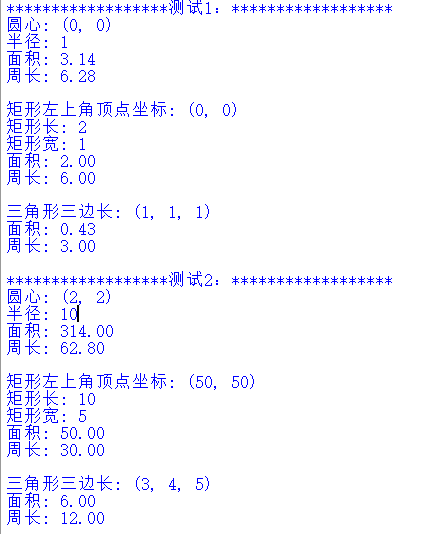
'''
shape.py是一个图形类模块
包括:
基类: 图形类Shape
派生类: 矩形类Rect, 圆形类Circle, 三角形类Triangle
'''

class Shape:
    '''形状基类'''
    def info(self):
        '''打印图形信息'''
        pass

    def area(self):
        '''计算面积'''
        pass
    def perimeter(self):
        '''计算周长'''
        pass


class Rect(Shape):
    '''
    矩形类, 继承自Shape
    属性:矩形左上角点的坐标、宽、高
    方法: 打印矩形信息,计算面积、周长
    '''
    def __init__(self, x = 0, y = 0, length = 2, width = 1):
        '''构造矩形对象,根据矩形左上角顶点坐标(x,y)和长、宽'''
        self._x = x
        self._y = y
        self._width = width
        self._length = length

    def info(self):
        print(f'矩形左上角顶点坐标: ({self._x}, {self._y})')
        print(f'矩形长: {self._length}')
        print(f'矩形宽: {self._width}')

    def area(self):
        return self._length * self._width

    def perimeter(self):
        return (self._length + self._width) * 2


class Circle(Shape):
    '''
    圆形类,继承自Shape
    属性:圆心坐标、半径
    方法: 打印圆信息,计算面积、周长
    '''
    def __init__(self, x = 0, y = 0, radius = 1):
        '''构造圆形对象,圆心坐标(x,y), 半径r'''
        self._x = x
        self._y = y
        self._r = radius

    def info(self):
        print(f'圆心: ({self._x}, {self._y})')
        print(f'半径: {self._r}')

    def area(self):
        return 3.14 * self._r * self._r

    def perimeter(self):
        return 2 * 3.14 * self._r


class Triangle(Shape):
    '''
    三角形类,继承自Shape
    属性:三边边长
    方法:打印三角形信息,计算周长、面积
    '''
    def __init__(self, a = 1, b = 1, c = 1):
        self._a, self._b, self._c = a, b, c

    def info(self):
        print(f'三角形三边长: ({self._a}, {self._b}, {self._c})')

    def area(self):
        s = (self._a + self._b + self._c) / 2
        ans = (s*(s - self._a)*(s - self._b)*(s - self._c)) ** 0.5
        return ans

    def perimeter(self):
        return (self._a + self._b + self._c)


# 测试类
def main():
    print('测试1:'.center(40, '*'))

    shapes_lst1 = [Circle(), Rect(), Triangle()]

    for t in shapes_lst1:
        t.info()
        print(f'面积: {t.area():.2f}')
        print(f'周长: {t.perimeter():.2f}')
        print()

    print('测试2:'.center(40, '*'))

    shapes_lst2 = [Circle(x = 2, y = 2, radius = 10),
                   Rect(x = 50, y = 50, length = 10, width = 5),
                   Triangle(a = 3, b = 4, c = 5)]

    for t in shapes_lst2:
        t.info()
        print(f'面积: {t.area():.2f}')
        print(f'周长: {t.perimeter():.2f}')
        print()


if __name__ == '__main__':
    main()
运行结果如图:
task2.py
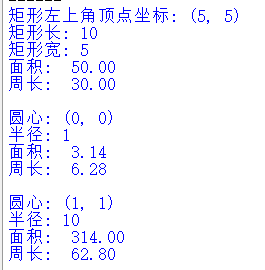
from shape import Rect, Circle

shape_lst = [Rect(5, 5, 10, 5), Circle(), Circle(1, 1, 10)]

for i in shape_lst:
    i.info()
    print(f'面积: {i.area(): .2f}')
    print(f'周长: {i.perimeter(): .2f}')
    print()
运行结果如图:
1.类的继承:使子类拥有父类的属性和方法
多态性:不同对象调用相同方法,或者一个对象调用不同方法,结果不一样
2.模块:.py文件
包:文件夹,包含若干个模块
库:包的集合
实验任务3
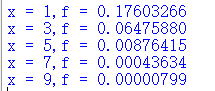
import math

def func(x):
    '''定义函数'''
    m = 0
    s = 2
    ans = (1/(((2 * math.pi)**(1/2))*s)) * math.exp((-1/2)*((x-m)/s)**2)
    return ans

print(f'x = 1,f = {func(1):.8f}')
print(f'x = 3,f = {func(3):.8f}')
print(f'x = 5,f = {func(5):.8f}')
print(f'x = 7,f = {func(7):.8f}')
print(f'x = 9,f = {func(9):.8f}')
运行结果如图:
实验任务4
random_walk.py
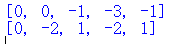
'''
random_walk.py是一个模块
封装了一个简易版的二维随机游走类
'''
from random import choice

class RandomWalk():
    '''一个生成随机漫步数据的类'''

    def __init__(self, num_points = 5000):
        '''初始化随机漫步的属性'''
        self.num_points = num_points

        # 所有的随机漫步都始于(0,0)
        self.x_values = [0]
        self.y_values = [0]

    def fill_walk(self):
        '''计算随机漫步包含的所有点'''

        # 不断漫步,直到列表到达指定长度
        while len(self.x_values) < self.num_points:
            # 决定前进方向,以及,沿这个方向前进的距离
            x_direction = choice([1, -1])
            x_distance = choice([0, 1, 2, 3, 4])
            x_step = x_direction * x_distance

            y_direction = choice([1, -1])
            y_distance = choice([0, 1, 2, 3, 4])
            y_step = y_direction * y_distance

            # 拒绝原地踏步
            if x_step == 0 and y_step == 0:
                continue

            # 计算下一个点的x和y值
            next_x = self.x_values[-1] + x_step
            next_y = self.y_values[-1] + y_step

            self.x_values.append(next_x)
            self.y_values.append(next_y)

def main():
    '''测试随机游走类'''
    rw = RandomWalk(5)
    rw.fill_walk()
    print(rw.x_values)
    print(rw.y_values)
运行结果如图:
task4.py
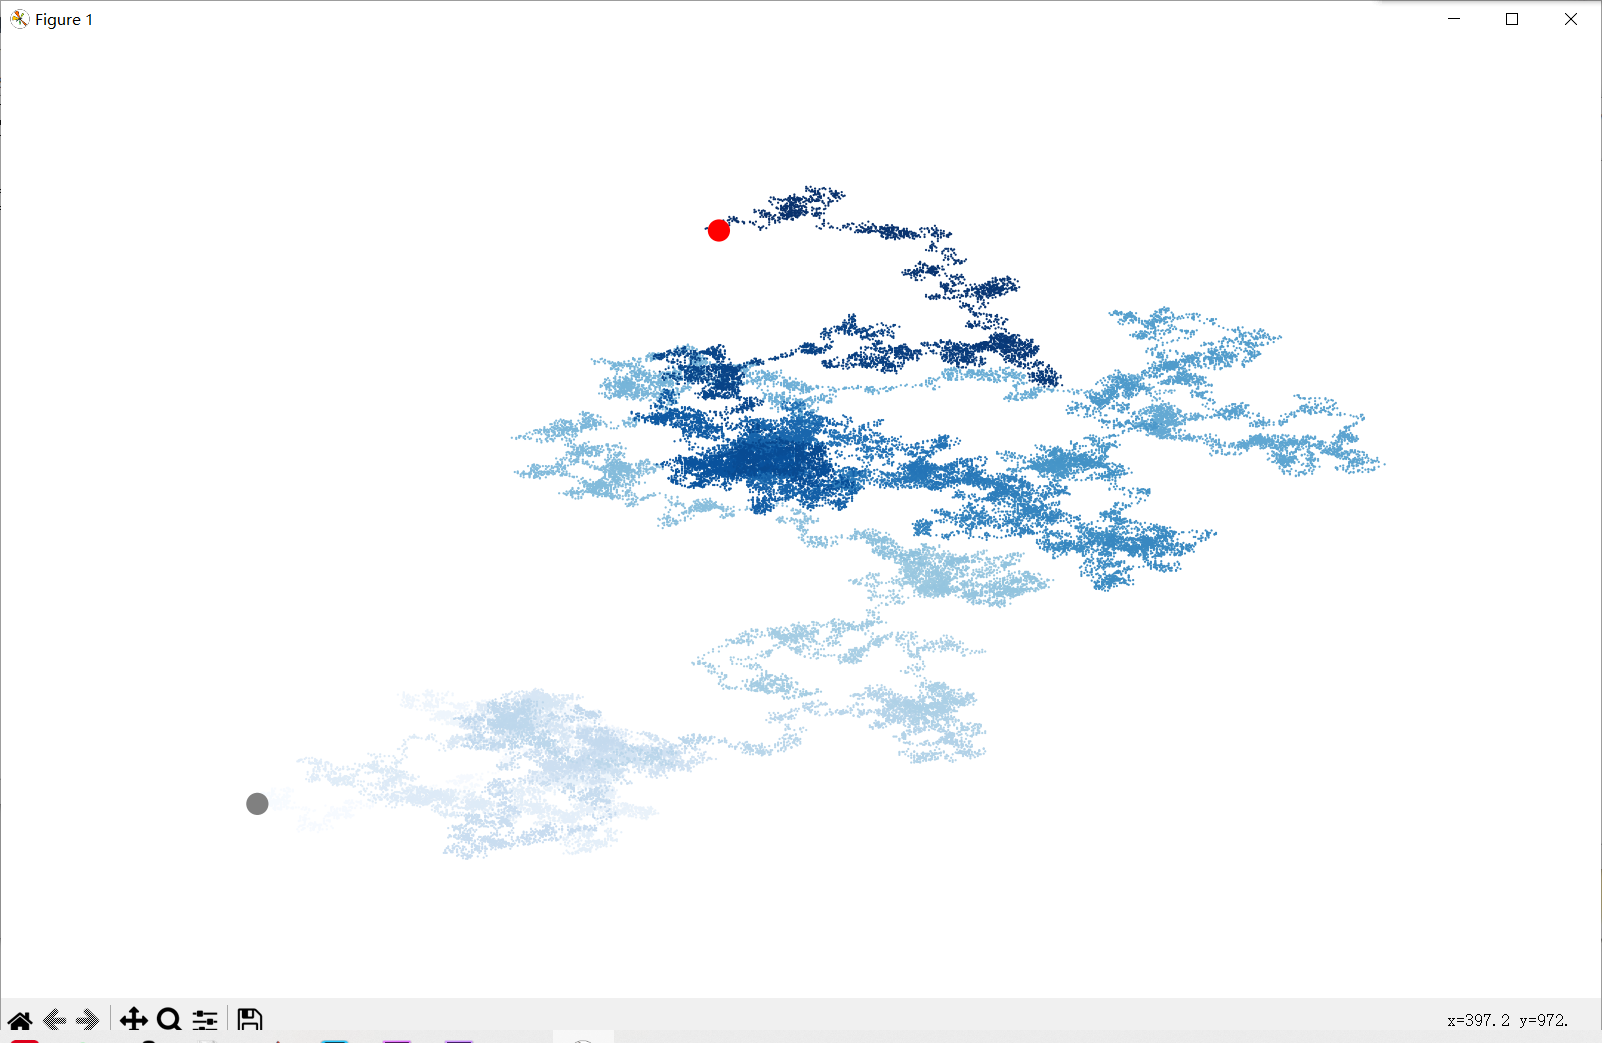
'''
模拟多次随机漫步
'''
from matplotlib import pyplot as plt
from random_walk import RandomWalk
from time import sleep

# 代码范例中,模拟两次随机漫步过程
n = 0
while n < 2:
    n += 1

    # 创建一个RandomWalk对象,调用其方法生成随机游走坐标
    rw = RandomWalk(50000)
    rw.fill_walk()

    # 用散点图进行可视化绘制
    plt.figure(figsize = (10, 6), dpi = 128)
    point_numbers = list(range(rw.num_points))
    plt.scatter(rw.x_values, rw.y_values, c=point_numbers,cmap=plt.cm.Blues, edgecolor='none', s=1)

    # 终点和起点
    plt.scatter(0, 0, c = 'grey', edgecolors='none', s=100)
    plt.scatter(rw.x_values[-1], rw.y_values[-1], c = 'red',
    edgecolors='none', s=100)

    # 隐藏坐标轴
    plt.axis('off')

    plt.show()
运行结果如图:
实验总结
面向对象的各种概念还需理解,辨别。库的运用比较简单。