(一)选题背景:
1. 便携性:电子书可以在电子设备上存储和阅读,便于携带和阅读;纸质书则需要占用更多的空间和重量,不太方便携带。因此,对于需要频繁出差或旅行的人来说,电子书可能更受欢迎。
2. 阅读体验:纸质书的纸张质感和印刷质量可以提供更好的阅读体验,而电子书则可能会受到屏幕反光、眼睛疲劳等问题的影响。因此,对于注重阅读体验的人来说,纸质书可能更受欢迎。
3. 价格:电子书通常比纸质书价格更便宜,因为它们不需要印刷和运输等成本。因此,对于注重价格的人来说,电子书可能更受欢迎。
4. 环保性:电子书不需要纸张和印刷,因此对环境的影响更小,更符合环保意识。因此,对于注重环保的人来说,电子书可能更受欢迎。
电子书多样 所以做一个简单的可视化分析帮助书荒友们进行选择
(二)简易步骤解释
1.爬取网站数据 网站:https://www.hongxiu.com/
2.对数据进行分析
三.具体步骤
1.对网站爬取并存储到文件中
 1 import requests
 2 from bs4 import BeautifulSoup
 3 from openpyxl import Workbook
 4
 5 base_url = 'https://www.hongxiu.com/category/f1_f1_f1_f1_f1_f1_0_'
 6 page_count = 40  # 要爬取的总页数
 7
 8 # 创建Excel工作簿和工作表
 9 workbook = Workbook()
10 sheet = workbook.active
11
12 # 设置表头
13 sheet['A1'] = '名称'
14 sheet['B1'] = '作者'
15 sheet['C1'] = '类型'
16 sheet['D1'] = '是否完结'
17 sheet['E1'] = '人气'
18 sheet['F1'] = '简介'
19
20 row = 2  # 从第二行开始写入数据
21
22 # 循环遍历每一页
23 for page in range(1, page_count + 1):
24     url = base_url + str(page)
25
26     # 发送HTTP请求获取页面内容
27     response = requests.get(url)
28     content = response.text
29
30     # 使用BeautifulSoup解析HTML内容
31     soup = BeautifulSoup(content, 'html.parser')
32
33     # 找到小说列表所在的HTML元素
34     novel_list = soup.find_all('div', class_='book-info')
35
36     # 遍历小说列表,提取所需信息
37     for novel in novel_list:
38         # 提取小说名称
39         name = novel.find('h3').a.text.strip()
40
41         # 提取作者
42         author = novel.find('h4').a.text.strip()
43
44         # 提取类型
45         category = novel.find('span', class_='org').text.strip()
46
47         # 提取是否完结
48         is_complete = novel.find('span', class_='pink').text.strip()
49
50         # 提取人气
51         popularity = novel.find('span', class_='blue').text.strip()
52
53         # 提取简介
54         intro = novel.find('p', class_='intro').text.strip()
55
56         # 将提取的数据写入Excel
57         sheet['A' + str(row)] = name
58         sheet['B' + str(row)] = author
59         sheet['C' + str(row)] = category
60         sheet['D' + str(row)] = is_complete
61         sheet['E' + str(row)] = popularity
62         sheet['F' + str(row)] = intro
63
64         row += 1
65
66 # 保存Excel文件
67 file_path = 'D:\gui\gui work.xlsx'
68 workbook.save(file_path)
69
70 print('数据已成功保存到Excel文件:', file_path)
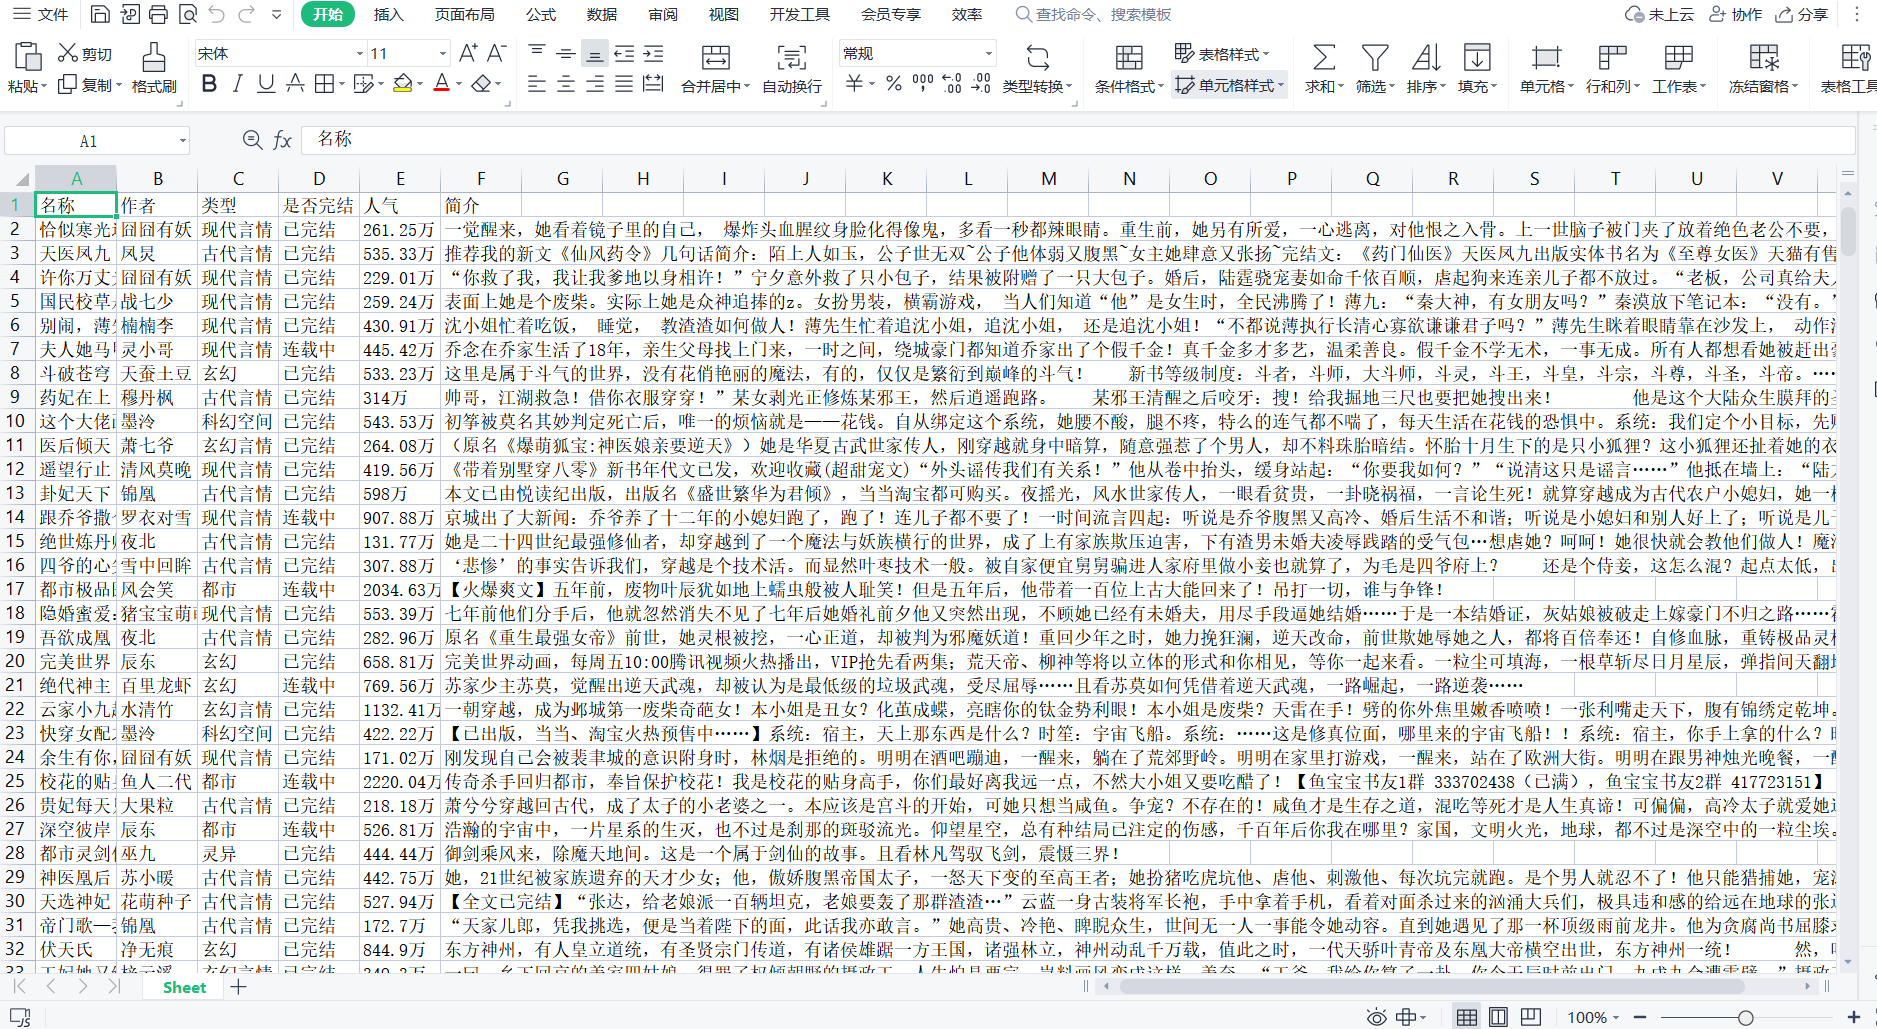
如图展示
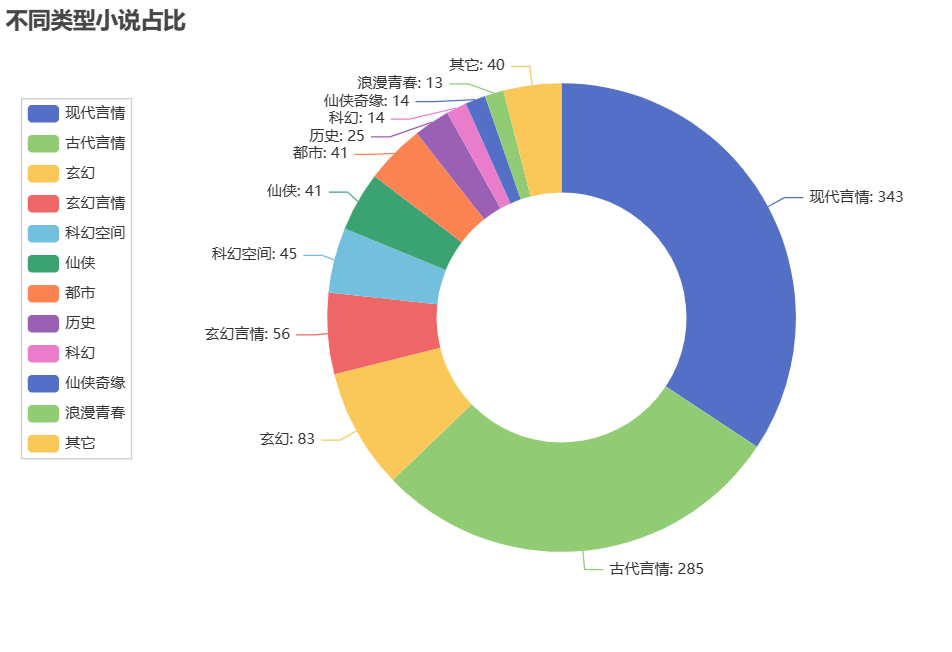
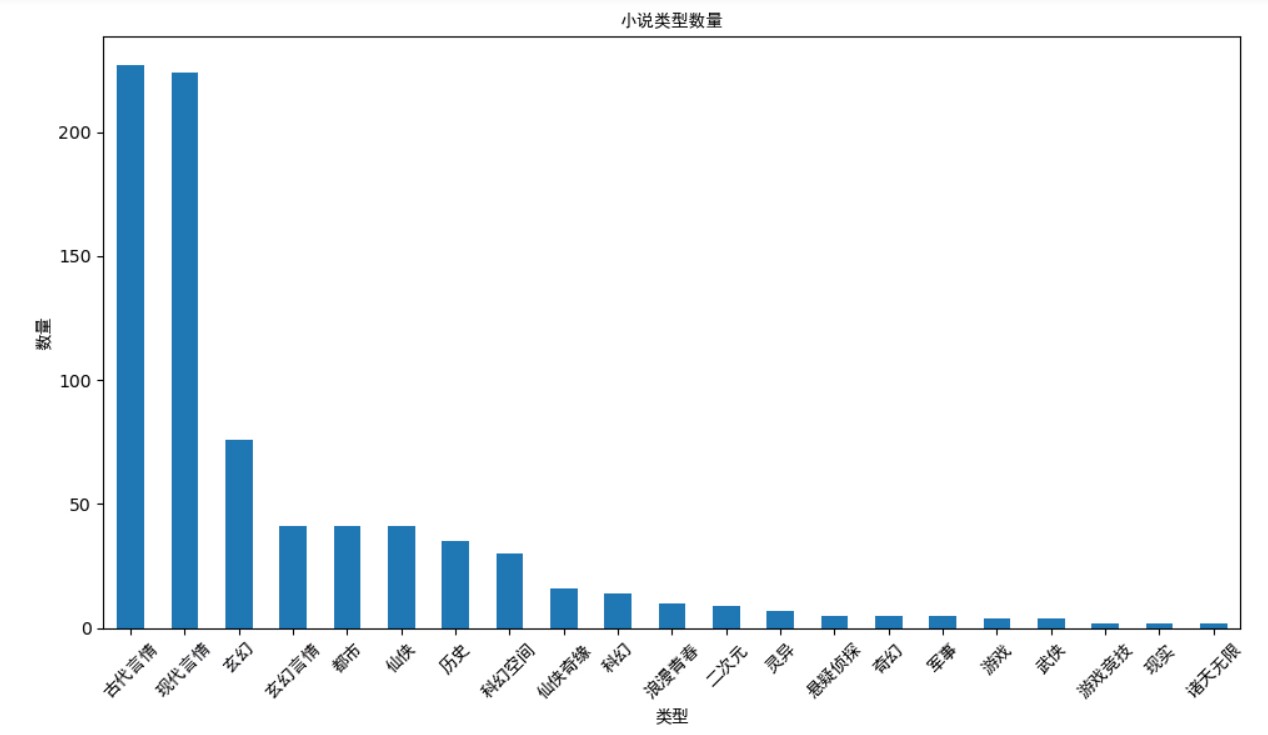
2.对所得的数据进行分析
 1 import pandas as pd
 2 from pyecharts import options as opts
 3 from pyecharts.charts import Pie
 4
 5 # 读取Excel文件中的数据
 6 file_path = 'D:\gui\gui work.xlsx'
 7 df = pd.read_excel(file_path)
 8
 9 # 统计不同类型小说的数量
10 category_counts = df['类型'].value_counts()
11
12 # 创建饼图
13 pie = (
14     Pie()
15     .add(
16         '',
17         [list(z) for z in zip(category_counts.index, category_counts.values)],
18         radius=['40%', '70%']
19     )
20     .set_global_opts(
21         title_opts=opts.TitleOpts(title="小说类型占比"),
22         legend_opts=opts.LegendOpts(orient="vertical", pos_top="15%", pos_left="2%")
23     )
24     .set_series_opts(label_opts=opts.LabelOpts(formatter="{b}: {c}"))
25 )
26
27 # 保存饼图为PNG文件
28 pie.render('D:\Edge gui\pie_chart.html')
29 png_file_path = 'D:\gui\pie_chart.png'
30 pie.render(png_file_path)
31
32 print('饼图已成功保存为PNG文件:', png_file_path)
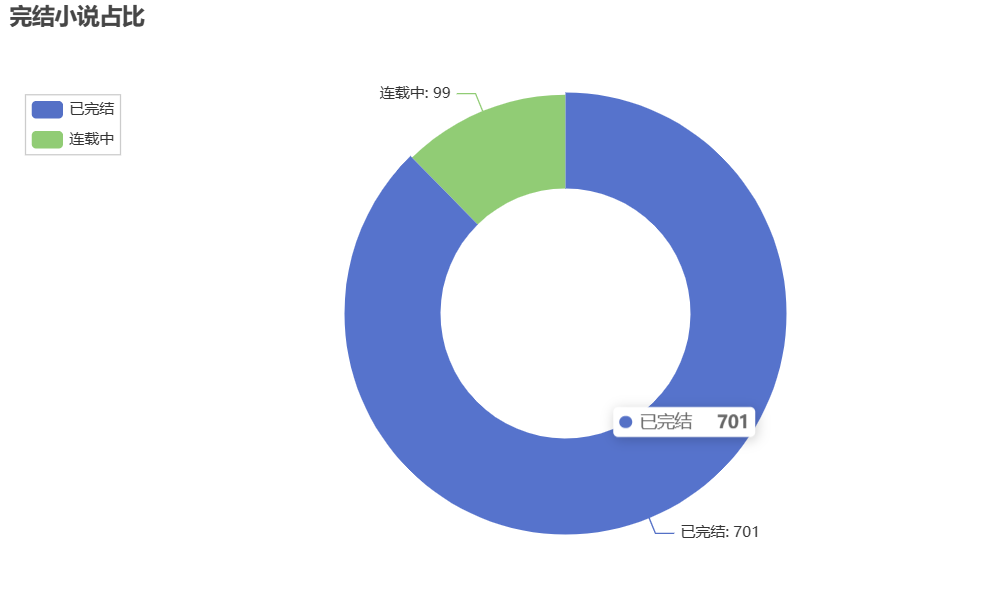
 1 import pandas as pd
 2 from pyecharts import options as opts
 3 from pyecharts.charts import Pie
 4
 5 # 读取Excel文件中的数据
 6 file_path = 'D:\gui\gui work.xlsx'
 7 df = pd.read_excel(file_path)
 8
 9 # 统计已完结和连载中小说的数量
10 complete_count = df[df['是否完结'] == '已完结'].shape[0]
11 ongoing_count = df[df['是否完结'] == '连载中'].shape[0]
12
13 # 创建饼图
14 pie = (
15     Pie()
16     .add(
17         '',
18         [('已完结', complete_count), ('连载中', ongoing_count)],
19         radius=['40%', '70%']
20     )
21     .set_global_opts(
22         title_opts=opts.TitleOpts(title="完结小说占比"),
23         legend_opts=opts.LegendOpts(orient="vertical", pos_top="15%", pos_left="2%")
24     )
25     .set_series_opts(label_opts=opts.LabelOpts(formatter="{b}: {c}"))
26 )
27
28 # 保存饼图为PNG文件
29 png_file_path = 'D:\gui\pie_chart1.png'
30 pie.render(png_file_path)
31
32 print('饼图已成功保存为PNG文件:', png_file_path)
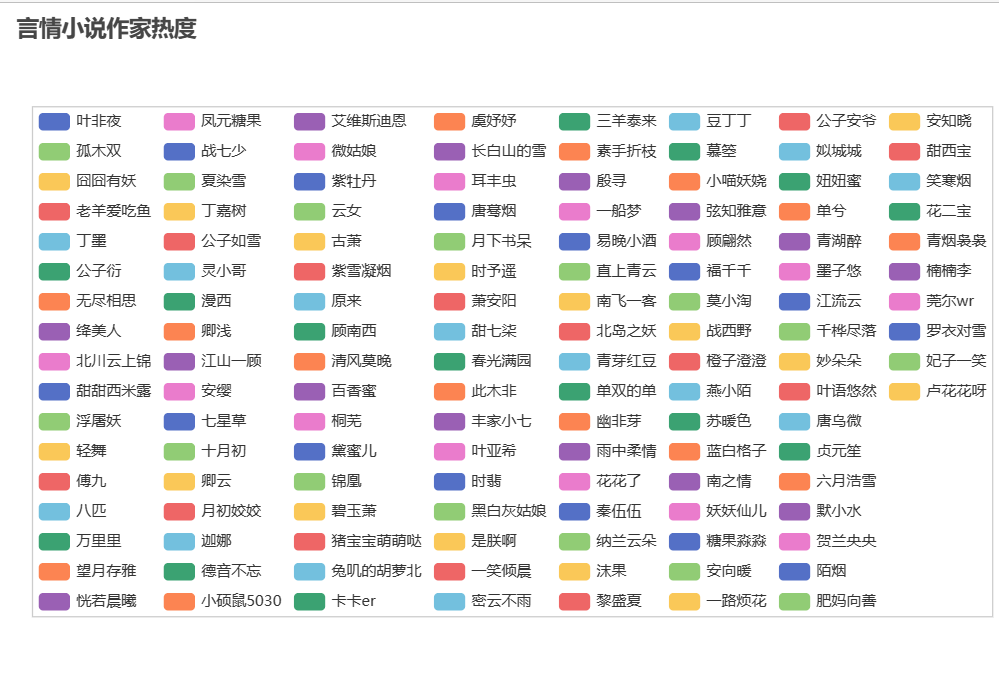
 1 import pandas as pd
 2 from pyecharts import options as opts
 3 from pyecharts.charts import Pie
 4
 5 # 读取Excel文件中的数据
 6 file_path = 'D:\gui\gui work.xlsx'
 7 df = pd.read_excel(file_path)
 8
 9 # 统计言情小说作家的热度
10 author_counts = df[df['类型'] == '现代言情']['作者'].value_counts()
11
12 # 创建饼图
13 pie = (
14 Pie()
15 .add(
16 '',
17 [list(z) for z in zip(author_counts.index, author_counts.values)],
18 radius=['40%', '70%']
19 )
20 .set_global_opts(
21 title_opts=opts.TitleOpts(title="言情小说作家热度"),
22 legend_opts=opts.LegendOpts(orient="vertical", pos_top="15%", pos_left="2%")
23 )
24 .set_series_opts(label_opts=opts.LabelOpts(formatter="{b}: {c}"))
25 )
26
27 # 保存饼图为PNG文件
28 png_file_path = 'D:\gui\pie_chart3.png'
29 pie.render(png_file_path)
30
31 print('饼图已成功保存为PNG文件:', png_file_path)
 1 import pandas as pd
 2
 3 # 读取Excel文件中的数据
 4 file_path = 'D:\gui\gui work.xlsx'
 5 df = pd.read_excel(file_path)
 6
 7 # 按人气降序排列,并选择前20名
 8 top_20_books = df.sort_values(by='人气', ascending=False).head(20)
 9
10 # 设置显示的列名
11 columns = ['图书名称', '作者', '类型', '是否完结', '人气', '简介']
12
13 # 生成表格
14 table = pd.DataFrame(top_20_books, columns=columns)
15
16 # 打印表格
17 print(table)
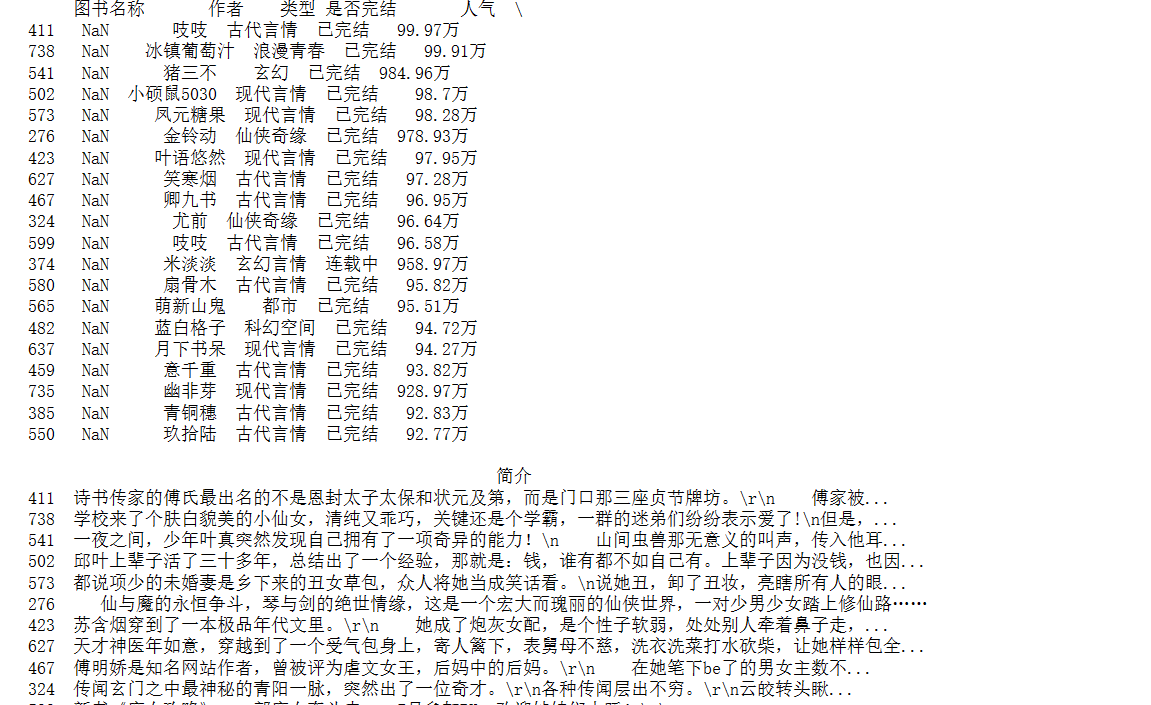
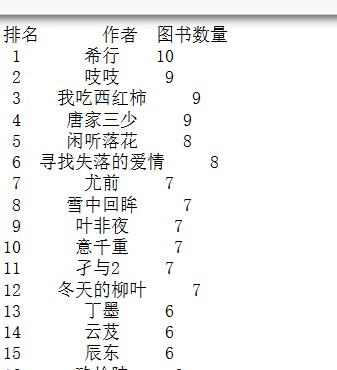
 1 import pandas as pd
 2
 3 # 读取Excel文件中的数据
 4 file_path = 'D:\gui\gui work.xlsx'
 5 df = pd.read_excel(file_path)
 6
 7 # 按人气降序排列,并选择前20名
 8 top_20_authors = df['作者'].value_counts().head(20)
 9
10 # 生成排行榜表格
11 rank_table = pd.DataFrame({'作者': top_20_authors.index, '图书数量': top_20_authors.values})
12
13 # 设置排名列
14 rank_table['排名'] = rank_table.index + 1
15
16 # 调整列的顺序
17 rank_table = rank_table[['排名', '作者', '图书数量']]
18
19 # 打印排行榜表格
20 print(rank_table)
 1 import pandas as pd
 2
 3 # 读取Excel文件中的数据
 4 file_path = 'D:\\gui\\gui work.xlsx'
 5 df = pd.read_excel(file_path)
 6
 7 # 按人气降序排列,并选择前20名
 8 top_20_authors = df['作者'].value_counts().head(20)
 9
10 # 生成排行榜表格
11 rank_table = pd.DataFrame({'作者': top_20_authors.index, '图书数量': top_20_authors.values})
12
13 # 设置排名列
14 rank_table['排名'] = rank_table.index + 1
15
16 # 调整列的顺序
17 rank_table = rank_table[['排名', '作者', '图书数量']]
18
19 # 打印排行榜表格
20 print(rank_table)
  1 import requests
  2  2 from bs4 import BeautifulSoup
  3  3 from openpyxl import Workbook
  4  4
  5
  6 5 base_url = 'https://www.hongxiu.com/category/f1_f1_f1_f1_f1_f1_0_'
  7  6 page_count = 40  # 要爬取的总页数
  8  7
  9  8 # 创建Excel工作簿和工作表
 10  9 workbook = Workbook()
 11 10 sheet = workbook.active
 12 11
 13 12 # 设置表头
 14 13 sheet['A1'] = '名称'
 15 14 sheet['B1'] = '作者'
 16 15 sheet['C1'] = '类型'
 17 16 sheet['D1'] = '是否完结'
 18 17 sheet['E1'] = '人气'
 19 18 sheet['F1'] = '简介'
 20
 21 19
 22 20 row = 2  # 从第二行开始写入数据
 23 21
 24 22 # 循环遍历每一页
 25 23 for page in range(1, page_count + 1):
 26 24     url = base_url + str(page)
 27 25
 28 26     # 发送HTTP请求获取页面内容
 29 27     response = requests.get(url)
 30 28     content = response.text
 31 29
 32
 33 30     # 使用BeautifulSoup解析HTML内容
 34 31     soup = BeautifulSoup(content, 'html.parser')
 35 32
 36 33     # 找到小说列表所在的HTML元素
 37 34     novel_list = soup.find_all('div', class_='book-info')
 38 35
 39 36     # 遍历小说列表,提取所需信息
 40 37     for novel in novel_list:
 41
 42 38         # 提取小说名称
 43 39         name = novel.find('h3').a.text.strip()
 44 40
 45 41         # 提取作者
 46 42         author = novel.find('h4').a.text.strip()
 47 43
 48 44         # 提取类型
 49 45         category = novel.find('span', class_='org').text.strip()
 50 46
 51 47         # 提取是否完结
 52 48         is_complete = novel.find('span', class_='pink').text.strip()
 53 49
 54 50         # 提取人气
 55 51         popularity = novel.find('span', class_='blue').text.strip()
 56 52
 57 53         # 提取简介
 58 54         intro = novel.find('p', class_='intro').text.strip()
 59 55
 60
 61 56         # 将提取的数据写入Excel
 62 57         sheet['A' + str(row)] = name
 63 58         sheet['B' + str(row)] = author
 64 59         sheet['C' + str(row)] = category
 65 60         sheet['D' + str(row)] = is_complete
 66 61         sheet['E' + str(row)] = popularity
 67 62         sheet['F' + str(row)] = intro
 68 63
 69 64         row += 1
 70 65
 71
 72 66 # 保存Excel文件
 73 67 file_path = 'D:\gui\gui work.xlsx'
 74 68 workbook.save(file_path)
 75 69
 76 70 print('数据已成功保存到Excel文件:', file_path)
 77
 78  如图展示
 79 2.对所得的数据进行分析
 80  1 import pandas as pd
 81  2 from pyecharts import options as opts
 82  3 from pyecharts.charts import Pie
 83  4
 84
 85 5 # 读取Excel文件中的数据
 86  6 file_path = 'D:\gui\gui work.xlsx'
 87  7 df = pd.read_excel(file_path)
 88  8
 89
 90 9 # 统计不同类型小说的数量
 91 10 category_counts = df['类型'].value_counts()
 92 11
 93
 94 12 # 创建饼图
 95 13 pie = (
 96 14     Pie()
 97 15     .add(
 98 16         '',
 99 17         [list(z) for z in zip(category_counts.index, category_counts.values)],
100 18         radius=['40%', '70%']
101 19     )
102 20     .set_global_opts(
103 21         title_opts=opts.TitleOpts(title="小说类型占比"),
104 22         legend_opts=opts.LegendOpts(orient="vertical", pos_top="15%", pos_left="2%")
105 23     )
106 24     .set_series_opts(label_opts=opts.LabelOpts(formatter="{b}: {c}"))
107 25 )
108 26
109
110 27 # 保存饼图为PNG文件
111 28 pie.render('D:\Edge gui\pie_chart.html')
112 29 png_file_path = 'D:\gui\pie_chart.png'
113 30 pie.render(png_file_path)
114 31
115 32 print('饼图已成功保存为PNG文件:', png_file_path)
116
117  1 import pandas as pd
118  2 from pyecharts import options as opts
119  3 from pyecharts.charts import Pie
120  4
121
122  5 # 读取Excel文件中的数据
123  6 file_path = 'D:\gui\gui work.xlsx'
124  7 df = pd.read_excel(file_path)
125  8
126  9 # 统计已完结和连载中小说的数量
127 10 complete_count = df[df['是否完结'] == '已完结'].shape[0]
128 11 ongoing_count = df[df['是否完结'] == '连载中'].shape[0]
129 12
130
131 13 # 创建饼图
132 14 pie = (
133 15     Pie()
134 16     .add(
135 17         '',
136 18         [('已完结', complete_count), ('连载中', ongoing_count)],
137 19         radius=['40%', '70%']
138 20     )
139 21     .set_global_opts(
140 22         title_opts=opts.TitleOpts(title="完结小说占比"),
141 23         legend_opts=opts.LegendOpts(orient="vertical", pos_top="15%", pos_left="2%")
142 24     )
143 25     .set_series_opts(label_opts=opts.LabelOpts(formatter="{b}: {c}"))
144 26 )
145 27
146
147 28 # 保存饼图为PNG文件
148 29 png_file_path = 'D:\gui\pie_chart1.png'
149 30 pie.render(png_file_path)
150 31
151 32 print('饼图已成功保存为PNG文件:', png_file_path)
152
153
154  1 import pandas as pd
155  2 from pyecharts import options as opts
156  3 from pyecharts.charts import Pie
157  4
158  5 # 读取Excel文件中的数据
159  6 file_path = 'D:\gui\gui work.xlsx'
160  7 df = pd.read_excel(file_path)
161  8
162  9 # 统计言情小说作家的热度
163 10 author_counts = df[df['类型'] == '现代言情']['作者'].value_counts()
164 11
165
166 12 # 创建饼图
167 13 pie = (
168 14 Pie()
169 15 .add(
170 16 '',
171 17 [list(z) for z in zip(author_counts.index, author_counts.values)],
172 18 radius=['40%', '70%']
173 19 )
174 20 .set_global_opts(
175 21 title_opts=opts.TitleOpts(title="言情小说作家热度"),
176 22 legend_opts=opts.LegendOpts(orient="vertical", pos_top="15%", pos_left="2%")
177 23 )
178 24 .set_series_opts(label_opts=opts.LabelOpts(formatter="{b}: {c}"))
179 25 )
180 26
181
182 27 # 保存饼图为PNG文件
183 28 png_file_path = 'D:\gui\pie_chart3.png'
184 29 pie.render(png_file_path)
185 30
186 31 print('饼图已成功保存为PNG文件:', png_file_path)
187
188
189  1 import pandas as pd
190  2
191  3 # 读取Excel文件中的数据
192  4 file_path = 'D:\gui\gui work.xlsx'
193  5 df = pd.read_excel(file_path)
194  6
195  7 # 按人气降序排列,并选择前20名
196  8 top_20_books = df.sort_values(by='人气', ascending=False).head(20)
197  9
198 10 # 设置显示的列名
199 11 columns = ['图书名称', '作者', '类型', '是否完结', '人气', '简介']
200 12
201
202 13 # 生成表格
203 14 table = pd.DataFrame(top_20_books, columns=columns)
204 15
205 16 # 打印表格
206 17 print(table)
207
208
209  1 import pandas as pd
210  2
211  3 # 读取Excel文件中的数据
212  4 file_path = 'D:\gui\gui work.xlsx'
213  5 df = pd.read_excel(file_path)
214  6
215  7 # 按人气降序排列,并选择前20名
216  8 top_20_authors = df['作者'].value_counts().head(20)
217  9
218 10 # 生成排行榜表格
219 11 rank_table = pd.DataFrame({'作者': top_20_authors.index, '图书数量': top_20_authors.values})
220 12
221
222 13 # 设置排名列
223 14 rank_table['排名'] = rank_table.index + 1
224 15
225 16 # 调整列的顺序
226 17 rank_table = rank_table[['排名', '作者', '图书数量']]
227 18
228 19 # 打印排行榜表格
229 20 print(rank_table)
230
231
232
233
234  import pandas as pd
235 # 读取Excel文件中的数据
236  4 file_path = 'D:\\gui\\gui work.xlsx'
237  5 df = pd.read_excel(file_path)
238  6
239  7 # 按人气降序排列,并选择前20名
240  8 top_20_authors = df['作者'].value_counts().head(20)
241  9
242 10 # 生成排行榜表格
243 11 rank_table = pd.DataFrame({'作者': top_20_authors.index, '图书数量': top_20_authors.values})
244 12
245 13 # 设置排名列
246 14 rank_table['排名'] = rank_table.index + 1
247 15
248 16 # 调整列的顺序
249 17 rank_table = rank_table[['排名', '作者', '图书数量']]
250 18
251 19 # 打印排行榜表格
252 20 print(rank_table)