001、生成测试子图
library(ggplot2)
library(dplyr)
## 依次生成测试子图p1、p2、p3、p4
p1 <- ggplot(mpg) +
  geom_point(aes(x = displ, y = hwy)) + ggtitle("P1")
p2 <- ggplot(mpg) +
  geom_bar(aes(x = as.character(year), fill = drv), position = "dodge") +
  ggtitle("P2")
p3 <- ggplot(mpg) +
  geom_density(aes(x = hwy, fill = drv), colour = NA) +
  facet_grid(rows = vars(drv)) + ggtitle("P3")
p4 <- ggplot(mpg) +
  stat_summary(aes(x = drv, y = hwy, fill = drv), geom = "col", fun.data = mean_se) +
  stat_summary(aes(x = drv, y = hwy), geom = "errorbar", fun.data = mean_se, width = 0.5) +
  ggtitle("P4")
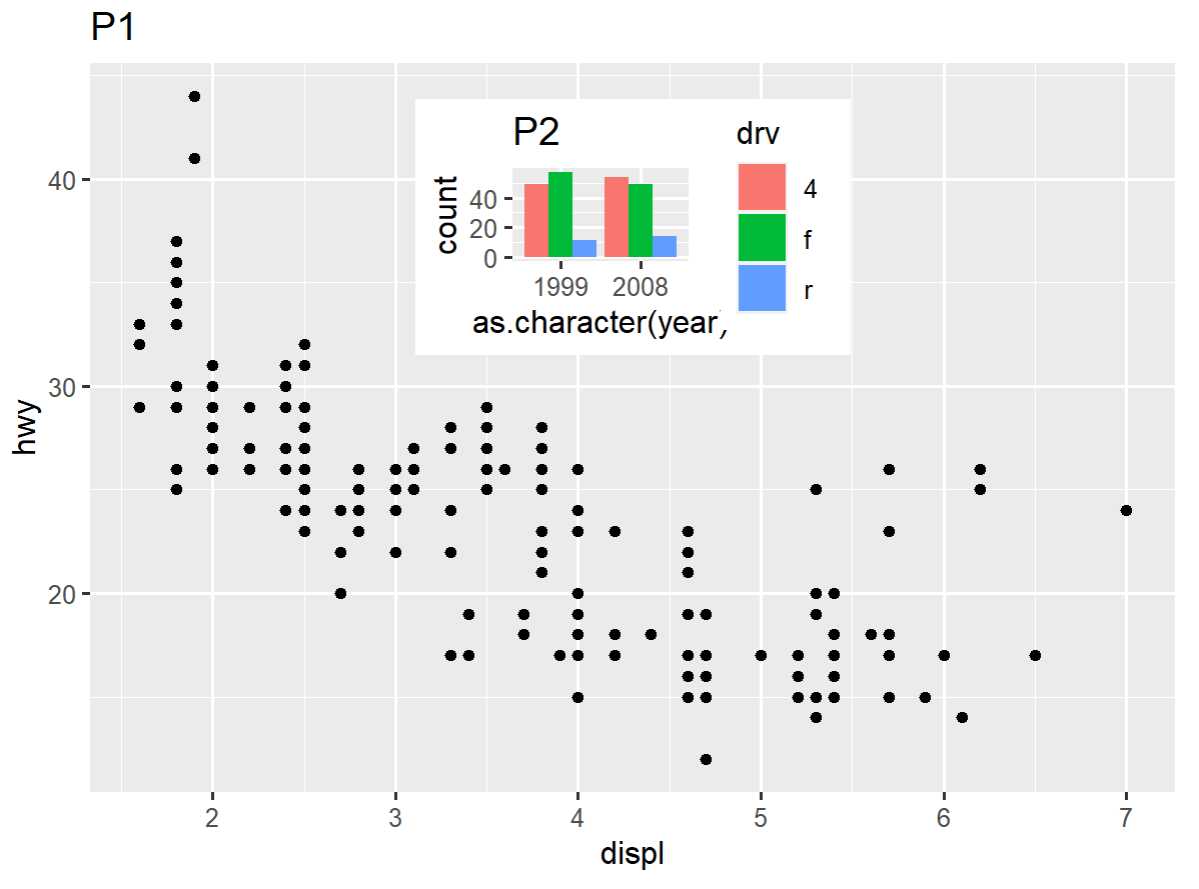
002、利用patchwork包中insert_element函数实现镶嵌,将图p2镶嵌入p1
library(patchwork)

p1 + inset_element(p2, left = 0.3, right = 0.7, bottom = 0.6,
top = 0.95)  ## left表示从左侧0.3开始绘制,right0.7表示到0.7结束; 同时从底部0.6开始,顶部0.95结束
绘图效果如下:
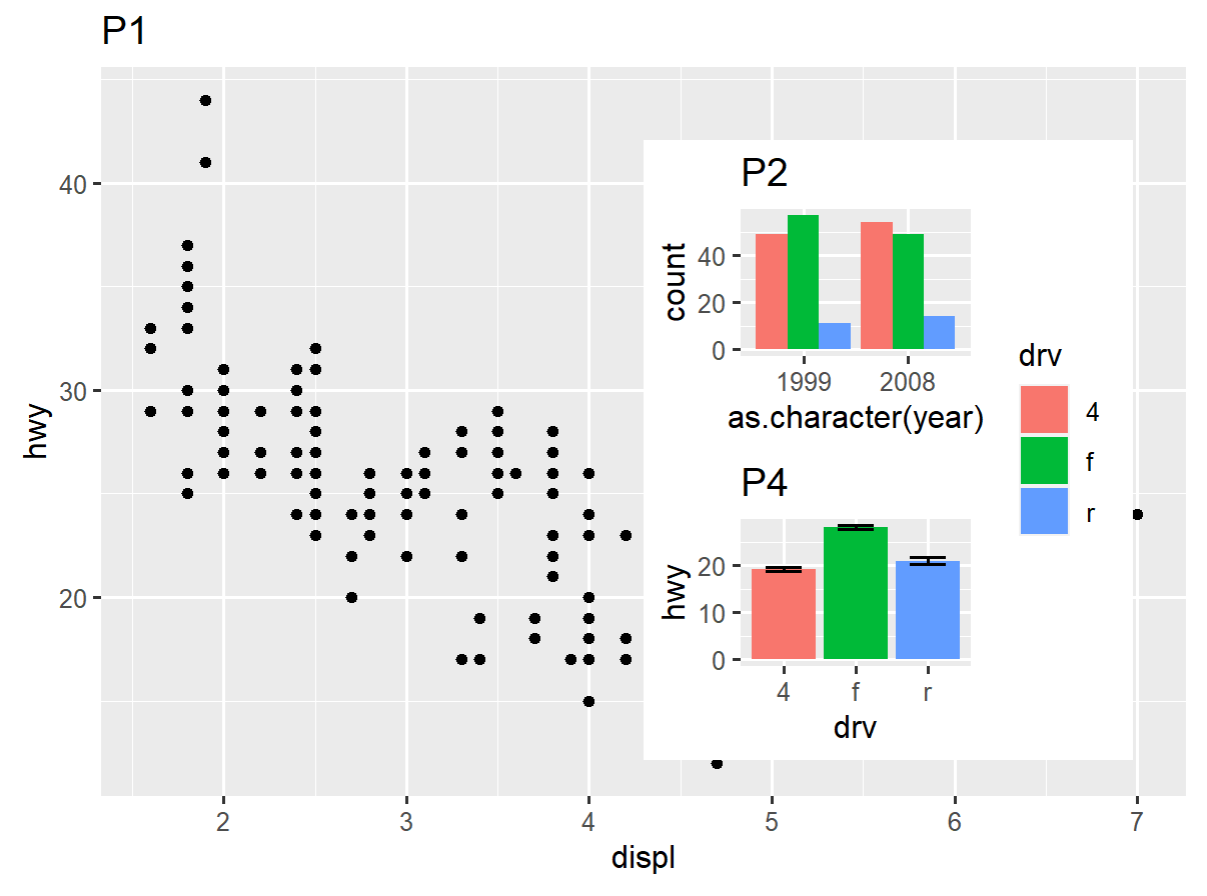
003、实现组合图的镶嵌
p24 <- p2 / p4 + plot_layout(guides = "collect")
p24        ## 组合图p24
p1 + inset_element(p24, left = 0.5, bottom = 0.05,
                   right = 0.95, top = 0.9)   ## 实现组合图的镶嵌
绘图效果如下: