一、分析数据可视化好友男女分布比例
 1 plt.rcParams['font.sans-serif']=['SimHei']
 2 #用来正常显示中文标签
 3 plt.rcParams['axes.unicode_minus']=False
 4
 5 # 1.读取csv文件,把性别信息读取出来
 6 def getSex(filename):
 7     lstsex = []
 8     with open(filename, 'r') as fr:
 9         reader = csv.reader(fr)
10         for i in reader:
11             lstsex.append(i[4])
12     return lstsex
13
14
15 # 2.性别可视化
16 def VisualSexpyechart(lstsex):
17     sex = dict()
18     # 2.1提取好友性别信息,从1开始,因为第0个是自己
19     for f in lstsex[1:]:
20         if f == '1':  # 男
21             sex["man"] = sex.get("man", 0) + 1
22         elif f == '2':  # 女
23             sex["women"] = sex.get("women", 0) + 1
24         else:  # 未知
25             sex["unknown"] = sex.get("unknown", 0) + 1
26     # 在屏幕上打印出来
27     total = len(lstsex[1:])
28     # 2.2打印出自己的好友性别比例
29     print("男性好友: %.2f%%" % (float(sex["man"]) / total * 100) + "   " + "女性好友: %.2f%%" % (
30                 float(sex["women"]) / total * 100) + "   " +
31           "不明性别好友: %.2f%%" % (float(sex["unknown"]) / total * 100))
32     plt.figure(figsize=(6,9))
33     labels = [u'男性好友',u'女性好友',u'性别不明']
34     sizes = [sex['man'],sex['women'],sex['unknown']]
35     colors = ['red','yellowgreen','lightskyblue']
36     explode = (0.05,0,0)
37     patches,l_text,p_text = plt.pie(sizes,explode=explode,labels=labels,colors=colors,labeldistance = 1.1,autopct = '%3.1f%%',shadow = False,startangle = 90,pctdistance = 0.6)
38     for t in l_text:
39        t.set_size(30)
40     for t in p_text:
41         t.set_size(20)
42     plt.axis('equal')
43     plt.legend()
44     plt.show()
45
46 # 3.执行主程序,得到所有好友性别
47 VisualSexpyechart(getSex("我的微信好友信息.csv"))

二、可视化省份来源
 1 import csv
 2
 3 from matplotlib import pyplot as plt
 4
 5 import matplotlib.pylab as plt
 6
 7 plt.rcParams['font.sans-serif']=['SimHei']
 8 #用来正常显示中文标签
 9 plt.rcParams['axes.unicode_minus']=False
10
11 # 1.读取csv文件,把省份信息读取出来
12 def getCity(filename):
13     lstcity = []
14     with open(filename, 'r') as fr:
15         reader = csv.reader(fr)
16         for i in reader:
17             lstcity.append(i[3])
18     return lstcity
19
20
21 # 2.可视化
22 def VisualSexpyechart(lstcity):
23     city = dict()
24     # 2.1提取好友省份信息
25     for f in lstcity[1:]:
26         if f == '山东':
27             city["山东"] = city.get("山东", 0) + 1
28         elif f == '黑龙江':
29             city["黑龙江"] = city.get("黑龙江", 0) + 1
30         elif f == '澳门':
31             city["澳门"] = city.get("澳门", 0) + 1
32         elif f == '吉林':
33             city["吉林"] = city.get("吉林", 0) + 1
34         elif f == '江苏':
35             city["江苏"] = city.get("江苏", 0) + 1
36         elif f == '贵州':
37             city["贵州"] = city.get("贵州", 0) + 1
38         elif f == '上海':
39             city["上海"] = city.get("上海", 0) + 1
40         elif f == '湖北':
41             city["湖北"] = city.get("湖北", 0) + 1
42         elif f == '北京':
43             city["北京"] = city.get("北京", 0) + 1
44         elif f == '浙江':
45             city["浙江"] = city.get("浙江", 0) + 1
46         elif f == '河北':
47             city["河北"] = city.get("河北", 0) + 1
48         elif f == '辽宁':
49             city["辽宁"] = city.get("辽宁", 0) + 1
50         elif f == '吉林':
51             city["吉林"] = city.get("吉林", 0) + 1
52         else :
53             city["未知"] = city.get("未知", 0) + 1
54     plt.figure(figsize=(6,9))
55     #labels = [u'山东',u'黑龙江',u'澳门',u'吉林',u'江苏',u'贵州',u'上海',u'湖北',u'北京',u'浙江',u'河北',u'辽宁',u'吉林',u'未知']
56     #sizes = [city["山东"],city["黑龙江"],city["澳门"],city["吉林"],city["江苏"],city["贵州"],citycity["上海"],city["湖北"],city["北京"],city["浙江"],city["河北"],city["辽宁"],city["吉林"],city["未知"]]
57     #colors = ['#ffff00','#ffcc00','#fff9900','#ff6600','#ff3300','#ffffcc','#ff99cc','#ff66cc','#dd33cc','#ff00ff','#99ff00','#99cc00','#996600','#993300']
58     x=[1,2,3,4,5]  # 确定柱状图数量,可以认为是x方向刻度

    这里随机找五个省份进行可视化
59     y=[city["山东"],city["黑龙江"],city["澳门"],city["吉林"],city["江苏"]]  # y方向刻度
60
61     color=['red','black','peru','orchid','deepskyblue']
62     x_label=['山东','黑龙江','澳门','吉林','江苏']
63     plt.xticks(x, x_label)  # 绘制x刻度标签
64     plt.bar(x, y,color=color)  # 绘制y刻度标签
65
66     #设置网格刻度
67     plt.grid(True,linestyle=':',color='r',alpha=0.6)
68     plt.show()
69
70 # 3.执行主程序,得到所有好友性别
71 VisualSexpyechart(getCity("我的微信好友信息.csv"))

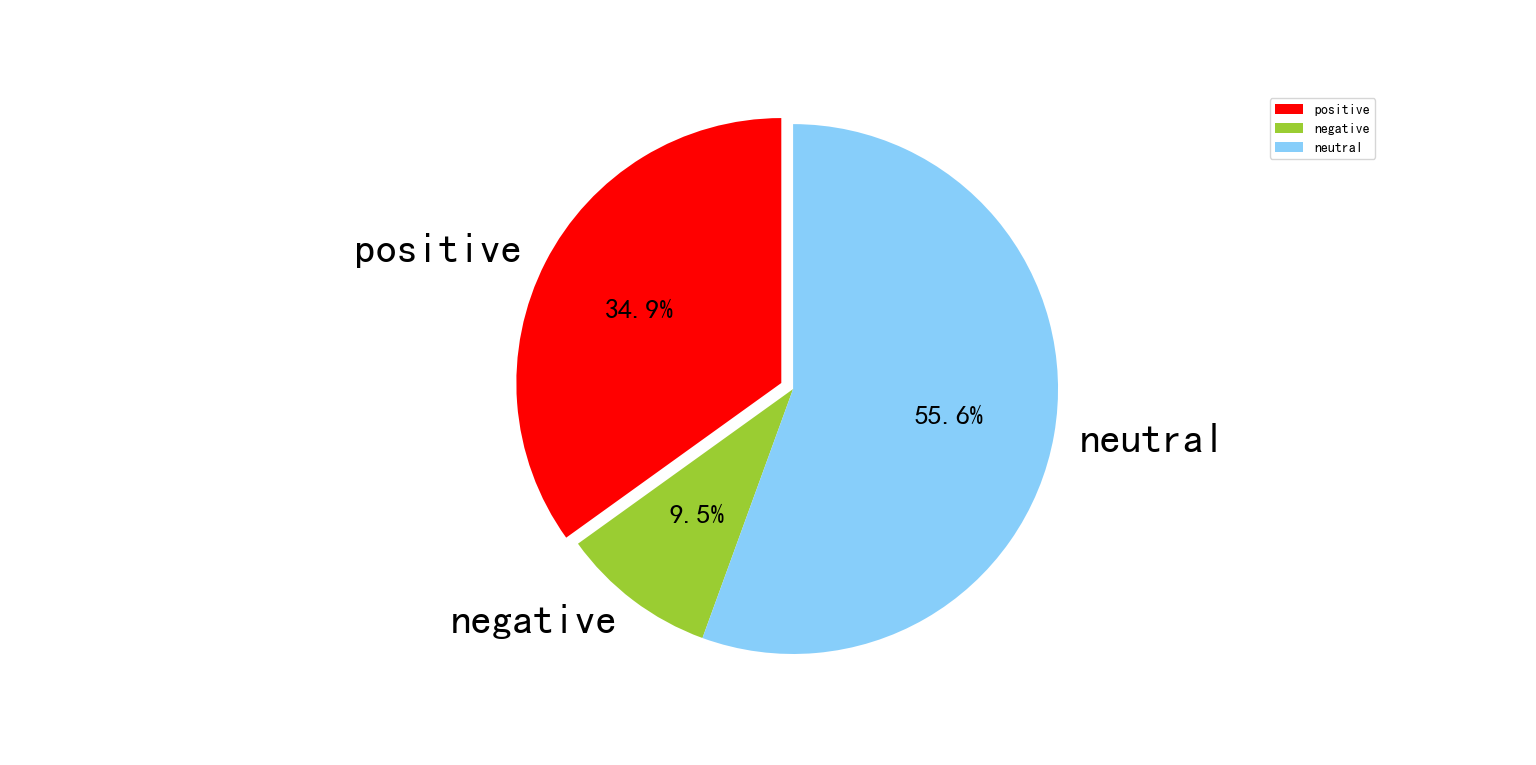
三、签名的情感强度值
首先将csv文件中的签名信息提取并保存到sign.txt中
 1 import csv
 2
 3 with open('我的微信好友信息.csv','r')as csvfile:
 4     reader = csv.reader(csvfile)
 5     #遍历每一行数据
 6     for row in reader:
 7         #获取签名数据
 8         signature = row[5]
 9         #如果签名不为空,则保存到txt文件中
10         if signature:
11             with open('sign.txt','a')as f:
12                 f.write(signature + '\n')
下面文件signEn.txt为sign.txt英文版
 1 import xlrd
 2 from textblob import TextBlob
 3 import nltk
 4 import numpy as np
 5 import pandas as pd
 6 from pyecharts.charts import Pie
 7 import csv
 8 from pyecharts import options as opts
 9
10 from matplotlib import pyplot as plt
11 plt.rcParams['font.sans-serif']=['SimHei']
12 #用来正常显示中文标签
13 plt.rcParams['axes.unicode_minus']=False
14
  blob
15 with open('signEn.txt', 'r') as file:
16     signatures = file.read()
17 polarity_scores = []
18 positive=0
19 negative=0
20 neutral=0
21 for signature in signatures.split('\n'):
22     blob = TextBlob(signature)
23     polarity_scores.append(blob.sentiment.polarity)
24 for i, score in enumerate(polarity_scores):
25     if score > 0:
       注释部分为输出判断签名的极性
26         #print(f"Signature {i+1} is positive.")
27         positive+=1
28     elif score < 0:
29         #print(f"Signature {i+1} is negative.")
30         negative+=1
31     else:
32         #print(f"Signature {i+1} is neutral.")
33         neutral+=1
34 igsize=(6,9)
35 labels = [u'positive',u'negative',u'neutral']
36 sizes = [positive,negative,neutral]
37 colors = ['red','yellowgreen','lightskyblue']
38 explode = (0.05,0,0)
39 patches,l_text,p_text=plt.pie(sizes,explode=explode,labels=labels,colors=colors,
40         labeldistance = 1.1,autopct = '%3.1f%%',shadow = False,
41         startangle = 90,pctdistance = 0.6)
42 for t in l_text:
43     t.set_size(30)
44 for t in p_text:
45     t.set_size(20)
46 plt.axis('equal')
47 plt.legend()
48 plt.show()