plotly坐标轴截断混合设置且指定设置截断时间的时候需要注意先后顺序
- 大范围的时间要在小范围的时间前设置,比如日内时间的截断要设置在日期截断的后面
- 同范围的规则截断要在指定截断前设置,对日期的截断,规则系截断最好在指定截断前设置,六日截断规则在指定日期截断前
以上两条为测试出来的规律,具体细节尚未细究与验证
1.测试代码:绘制不设置坐标轴范围截断的图
df = df[['datetime', 'v']]

fig = go.Figure(data=go.Figure(go.Scatter(x=df['datetime'],
                                          y=df['v'],
                                          mode='lines+markers',
                                          line=dict(width=1),
                                          marker=dict(size=1)
                                          )))

fig.update_xaxes(tickformat="%H:%M\n%Y-%m-%d",)
先看不设置坐标轴范围截断的图
中间有大片没有数据的线,占据了大量空间,将数据形状挤压得看不出来

2.测试代码:绘制设置坐标轴范围截断的图,去除坐标轴中的无数据的空白的时间段
df = df[['datetime', 'v']]

数据时间序列 = pd.Series(df['datetime'].dt.date.unique())
全量时间序列 = pd.Series(pd.date_range(start=数据时间序列.min(), end=数据时间序列.max(), freq='D').date)
需要删除时间序列 = 全量时间序列[全量时间序列.isin(数据时间序列) == False].values
需要删除时间序列 = [i.strftime('%Y-%m-%d') for i in 需要删除时间序列]

fig = go.Figure(data=go.Figure(go.Scatter(x=df['datetime'],
                                          y=df['v'],
                                          mode='lines+markers',
                                          line=dict(width=1),
                                          marker=dict(size=1)
                                          )))

fig.update_xaxes(
    tickformat="%H:%M\n%Y-%m-%d",
    rangebreaks=[
        dict(bounds=[6, 1], pattern='day of week'),   # 设置周六周日截断,规则截断
        dict(values=需要删除时间序列),                 # 补充截断一天中没有数据的日期,指定日期截断
        dict(bounds=[11.6, 13.4], pattern="hour"),    # 空白时间段,时间范围小于天
        dict(bounds=[15.1, 20.9], pattern='hour'),    # 空白时间段
        dict(bounds=[23.1, 8.9], pattern='hour')]     # 空白时间段
)
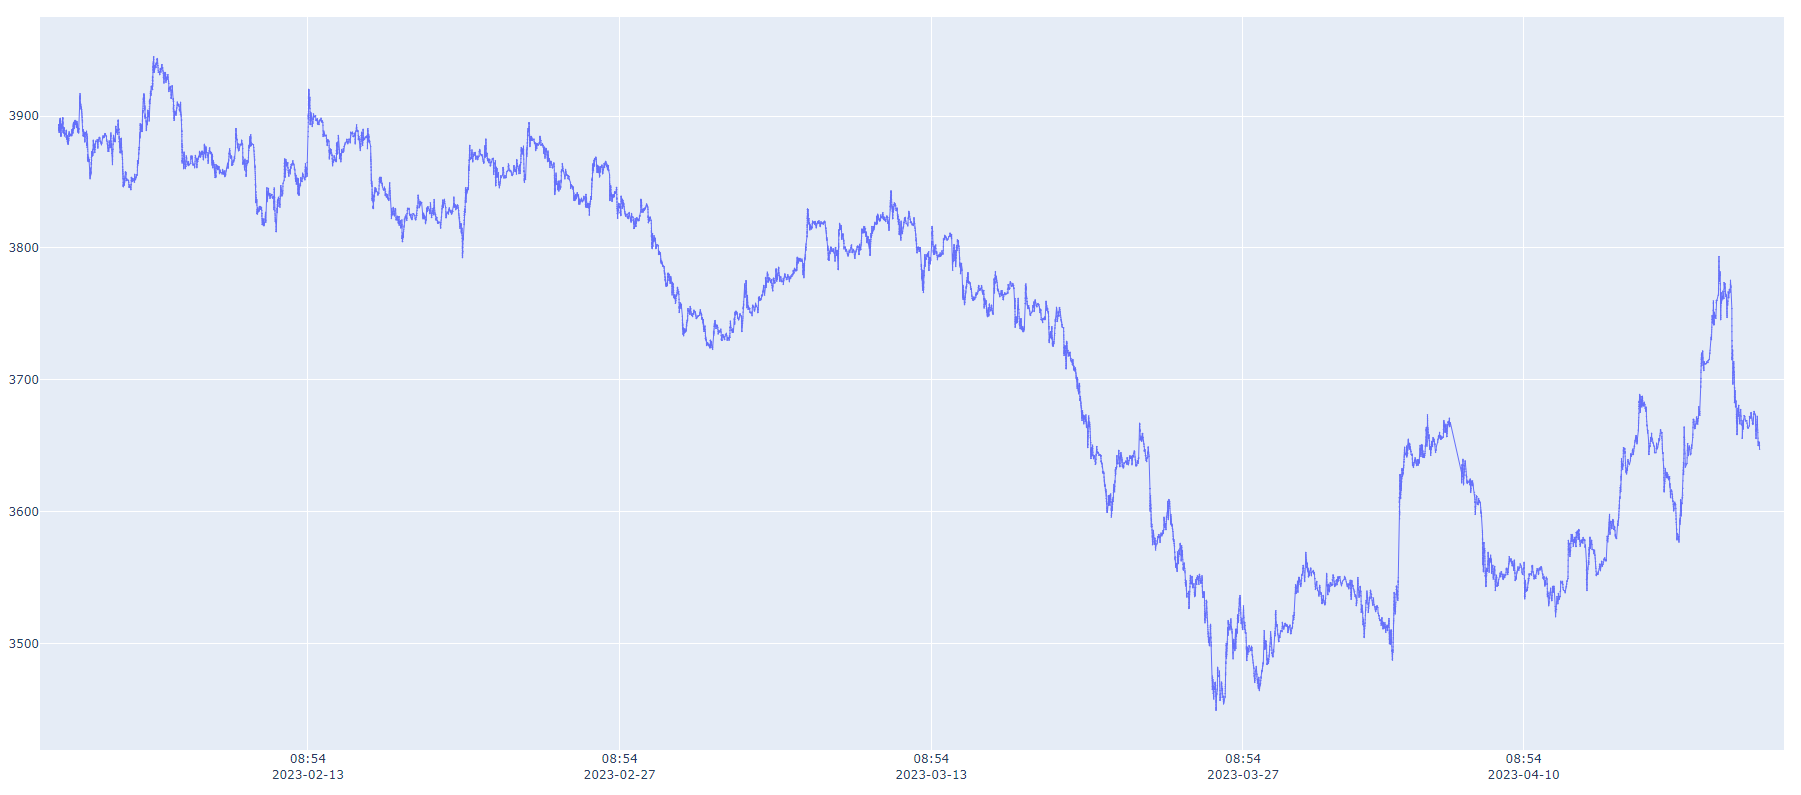
添加时间截断后,数据看起来就连贯了很多

3.测试代码:绘制设置坐标轴范围截断的图,去除坐标轴中的无数据的空白的时间段,但是将需要截断的时间设置在需要截断的日期前,这样会出现错误
df = df[['datetime', 'v']]
数据时间序列 = pd.Series(df['datetime'].dt.date.unique())
全量时间序列 = pd.Series(pd.date_range(start=数据时间序列.min(), end=数据时间序列.max(), freq='D').date)
需要删除时间序列 = 全量时间序列[全量时间序列.isin(数据时间序列) == False].values
需要删除时间序列 = [i.strftime('%Y-%m-%d') for i in 需要删除时间序列]

fig = go.Figure(data=go.Figure(go.Scatter(x=df['datetime'],
                                          y=df['v'],
                                          mode='lines+markers',
                                          line=dict(width=1),
                                          marker=dict(size=1)
                                          )))

fig.update_xaxes(
    tickformat="%H:%M\n%Y-%m-%d",
    rangebreaks=[
        dict(bounds=[11.6, 13.4], pattern="hour"),
        dict(bounds=[15.1, 20.9], pattern='hour'),
        dict(bounds=[23.1, 8.9], pattern='hour'),
        dict(bounds=[6, 1], pattern='day of week'),
        dict(values=需要删除时间序列)

        # 按照规则截断在指定日期截断后的顺序,画出来的图是空白
        # dict(values=需要删除时间序列),
        # dict(bounds=[6, 1], pattern='day of week'),

    ],
)
出现坐标轴重叠的现象,如下图
当调整周末代码在指定日期的代码后面的时候,画图甚至是空白的
