普罗米修斯教程参考
https://www.cnblogs.com/minseo/category/1688718.html
本文介绍怎么使用docker搭建
系统和软件版本
# cat /etc/redhat-release
CentOS Linux release 7.9.2009 (Core)
[root@CentOS7K8SHarbor061 ~]# uname -a
Linux CentOS7K8SHarbor061 3.10.0-1160.102.1.el7.x86_64 #1 SMP Tue Oct 17 15:42:21 UTC 2023 x86_64 x86_64 x86_64 GNU/Linux
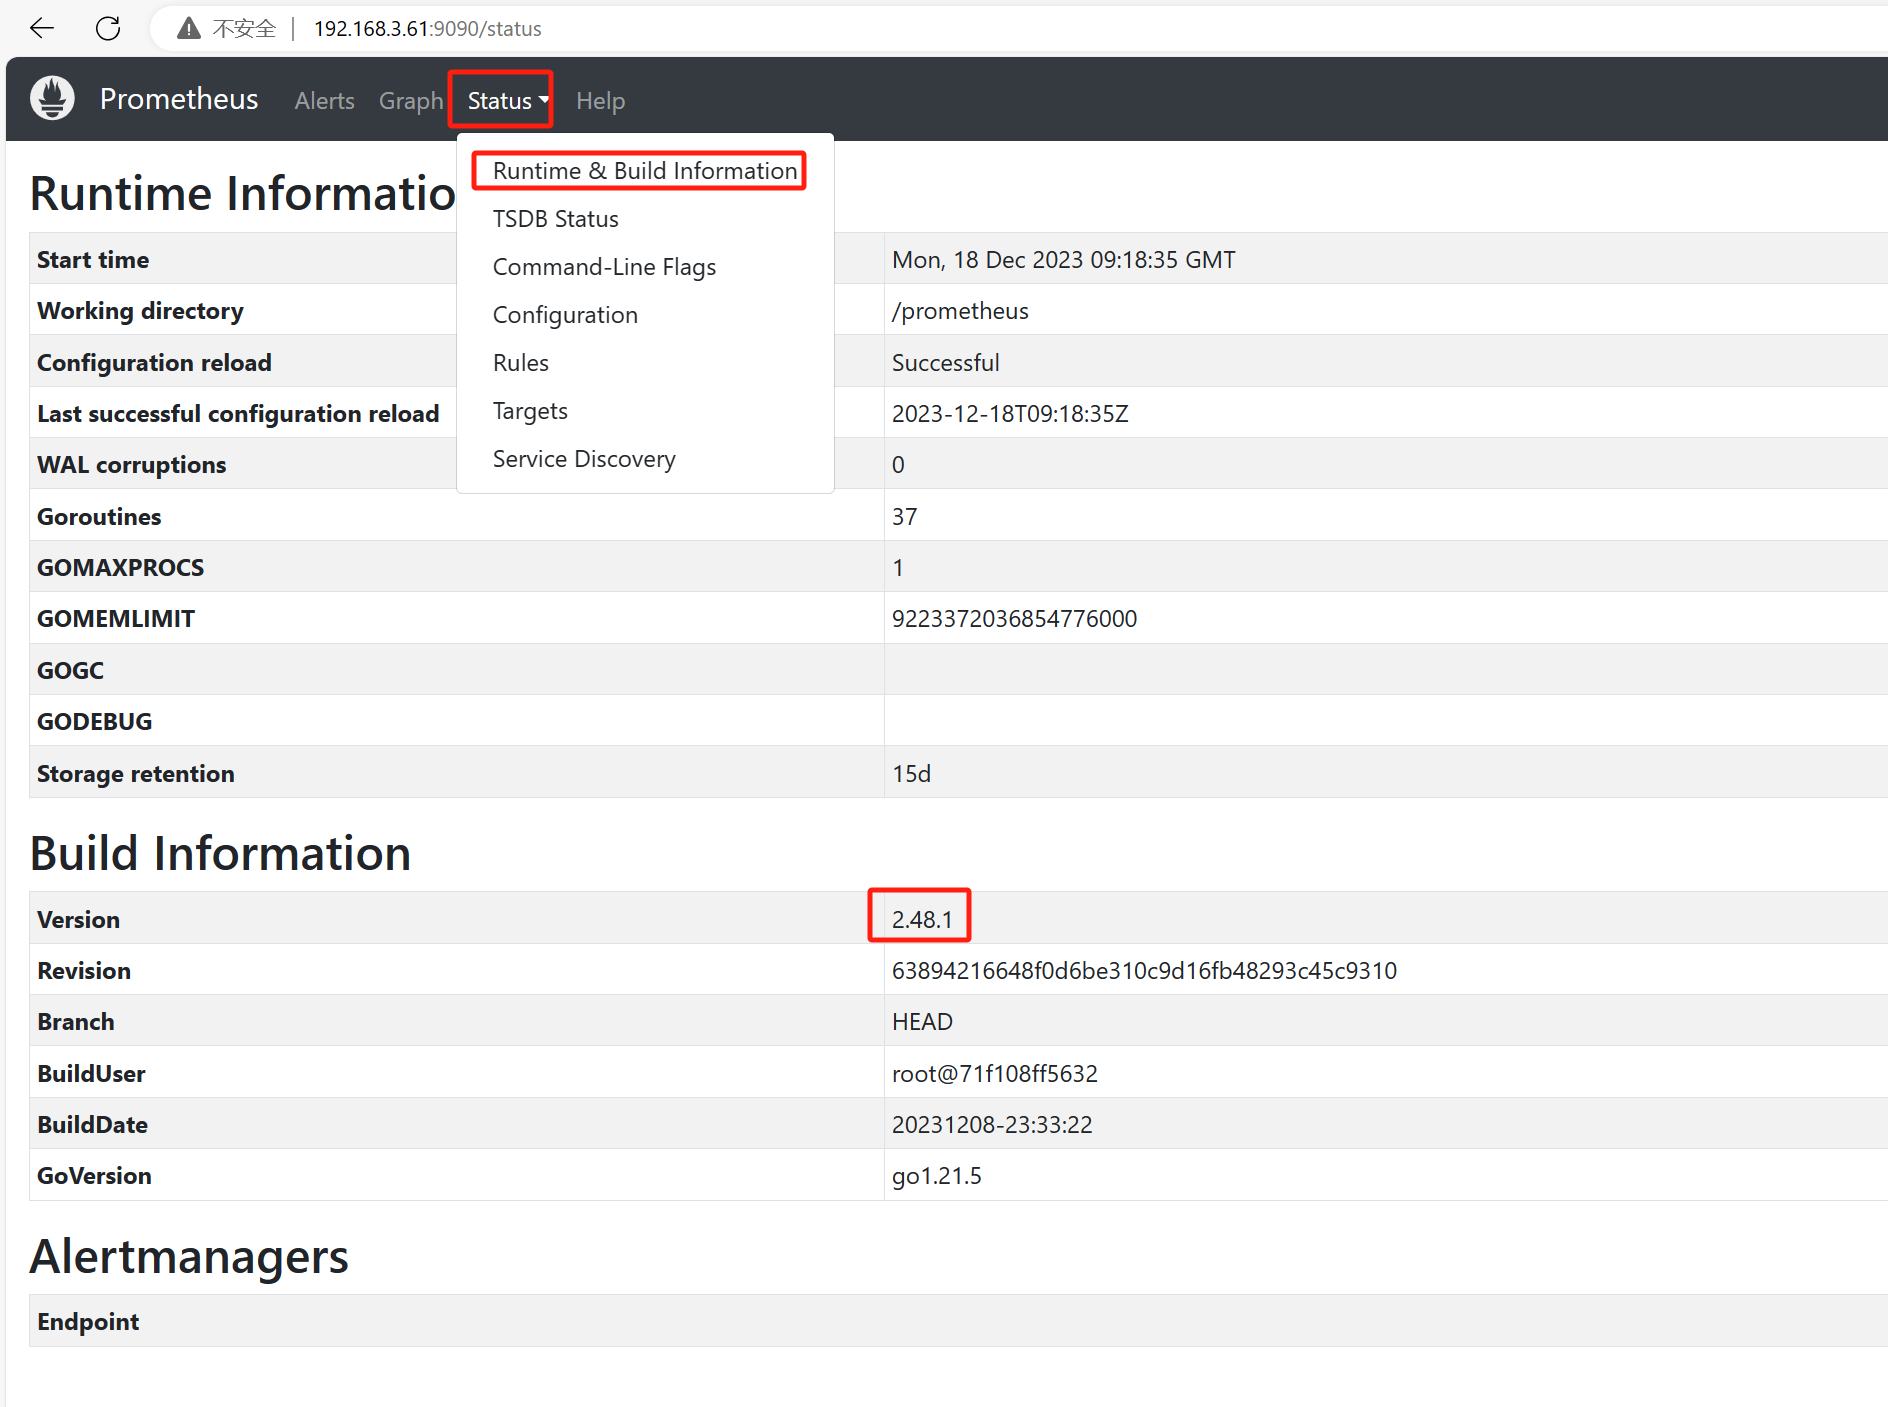
# prometheus版本
2.48.1
# node_export版本
node_exporter --version
node_exporter, version 1.7.0 (branch: HEAD, revision: 7333465abf9efba81876303bb57e6fadb946041b)
build user: root@35918982f6d8
build date: 20231112-23:53:35
go version: go1.21.4
platform: linux/amd64
tags: netgo osusergo static_build
# Grnfana版本
# grafana-cli --version
grafana version 10.2.2
怎么查看prometheus版本
安装Prometheus镜像
服务器端使用仅需在服务器端安装
下载
docker pull prom/prometheus
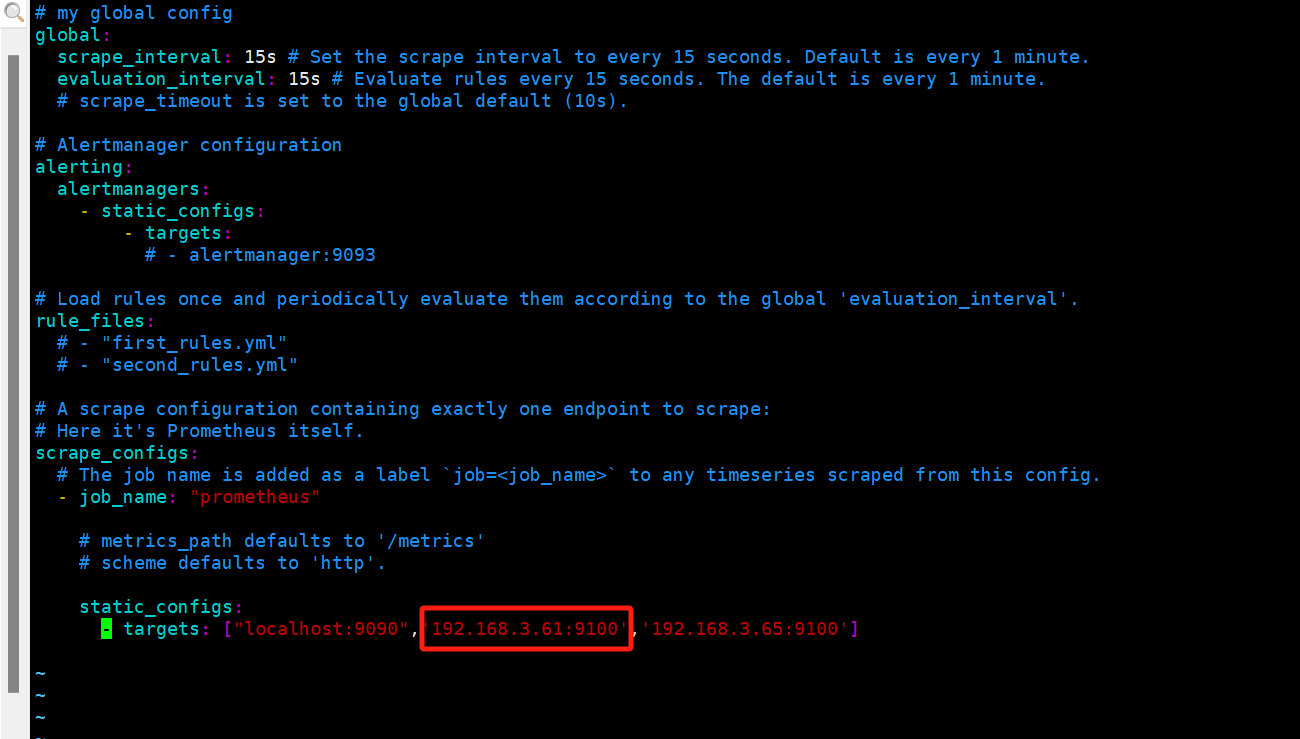
设置配置文件
# cat /data/softs/prometheus/prometheus.yml
# my global config
global:
  scrape_interval: 15s # Set the scrape interval to every 15 seconds. Default is every 1 minute.
  evaluation_interval: 15s # Evaluate rules every 15 seconds. The default is every 1 minute.
  # scrape_timeout is set to the global default (10s).

# Alertmanager configuration
alerting:
  alertmanagers:
    - static_configs:
        - targets:
          # - alertmanager:9093

# Load rules once and periodically evaluate them according to the global 'evaluation_interval'.
rule_files:
  # - "first_rules.yml"
  # - "second_rules.yml"

# A scrape configuration containing exactly one endpoint to scrape:
# Here it's Prometheus itself.
scrape_configs:
  # The job name is added as a label `job=<job_name>` to any timeseries scraped from this config.
  - job_name: "prometheus"

    # metrics_path defaults to '/metrics'
    # scheme defaults to 'http'.

    static_configs:
      - targets: ["loclhost:9090",'192.168.3.61:9100','192.168.3.65:9100']
配置文件解释参考
https://www.cnblogs.com/minseo/p/13360216.html
启动
docker run --name=prometheus --restart=unless-stopped -d -p 9090:9090 -v /data/softs/prometheus/prometheus.yml:/etc/prometheus/prometheus.yml prom/prometheus
参数解释
# 运行
docker run
# 自定义启动容器名称
--name=prometheus
# 除非手动停止否则启动保证开机自启动
--restart=unless-stopped
# 后台运行
-d
# 端口映射
-p 9090:9090
# 配置文件映射,如果修改了配置文件需重启docker容器
-v /data/softs/prometheus/prometheus.yml:/etc/prometheus/prometheus.yml
# 启动使用的镜像
prom/prometheus
启动后在本机映射9090端口
# lsof -i:9090
COMMAND     PID USER   FD   TYPE  DEVICE SIZE/OFF NODE NAME
docker-pr 15307 root    4u  IPv4 7759981      0t0  TCP *:websm (LISTEN)
docker-pr 15311 root    4u  IPv6 7759986      0t0  TCP *:websm (LISTEN)
使用IP加端口访问
安装node_export
在所有需要监控的主机客户端安装
下载镜像
docker pull prom/node-exporter
启动
docker run --name=node-exporter --restart=unless-stopped -d -p 9100:9100 prom/node-exporter
解释
# 运行
docker run
# 自定义容器名
--name=node-exporter
# 除非手动停止否则自启动
--restart=unless-stopped
# 后台运行
-d
# 端口映射
-p 9100:9100
# 使用的镜像
prom/node-exporter
修改服务器端的配置文件添加目标客户端即可
修改完毕重启docker容器
docker restaet prometheus
安装图像软件grafana
下载
wget https://dl.grafana.com/oss/release/grafana-10.2.2-1.x86_64.rpm
安装启动
rpm -ivh grafana-10.2.2-1.x86_64.rpm
systemctl start grafana-server.service
systemctl enable grafana-server.service
页面访问
默认端口3000
默认用户名和密码admin/admin第一次登录需要修改密码
http://IP:3000
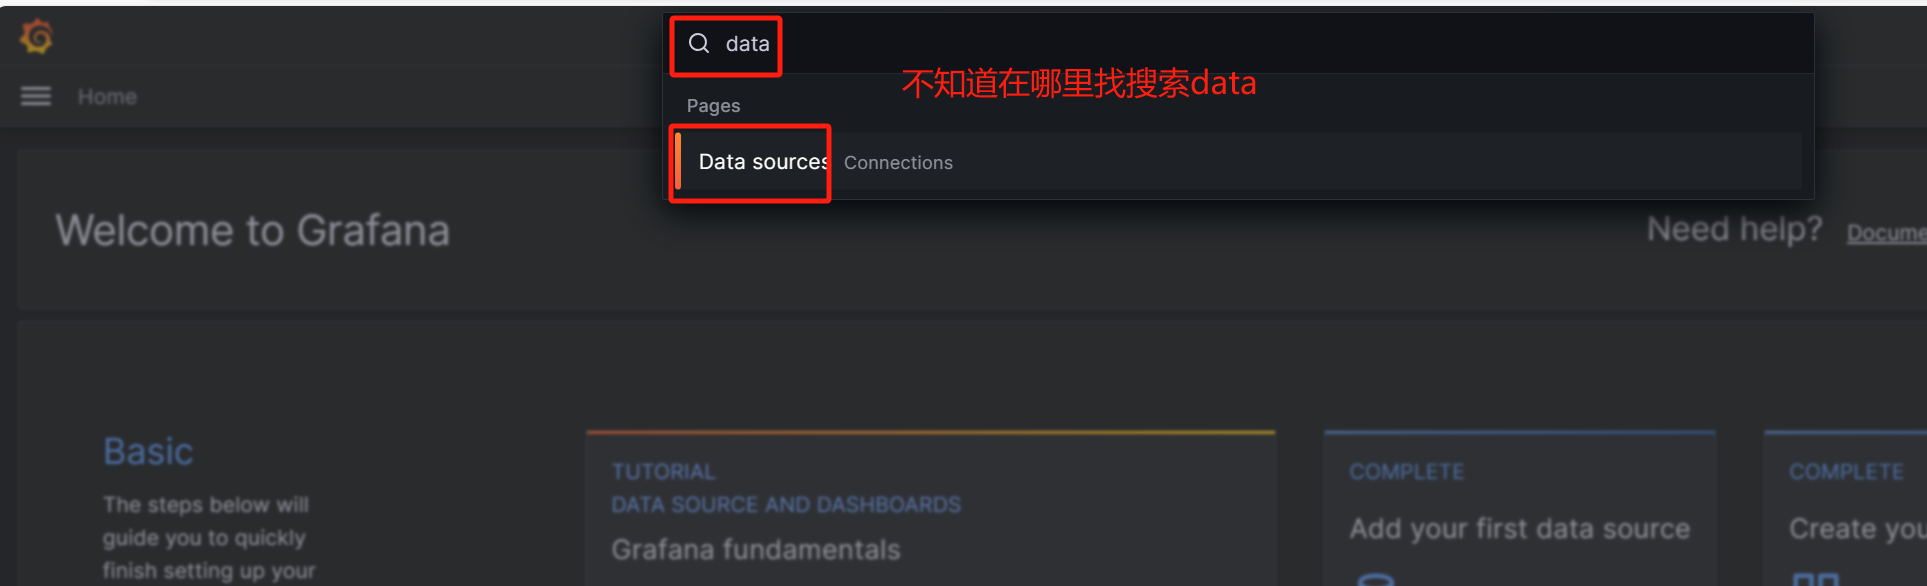
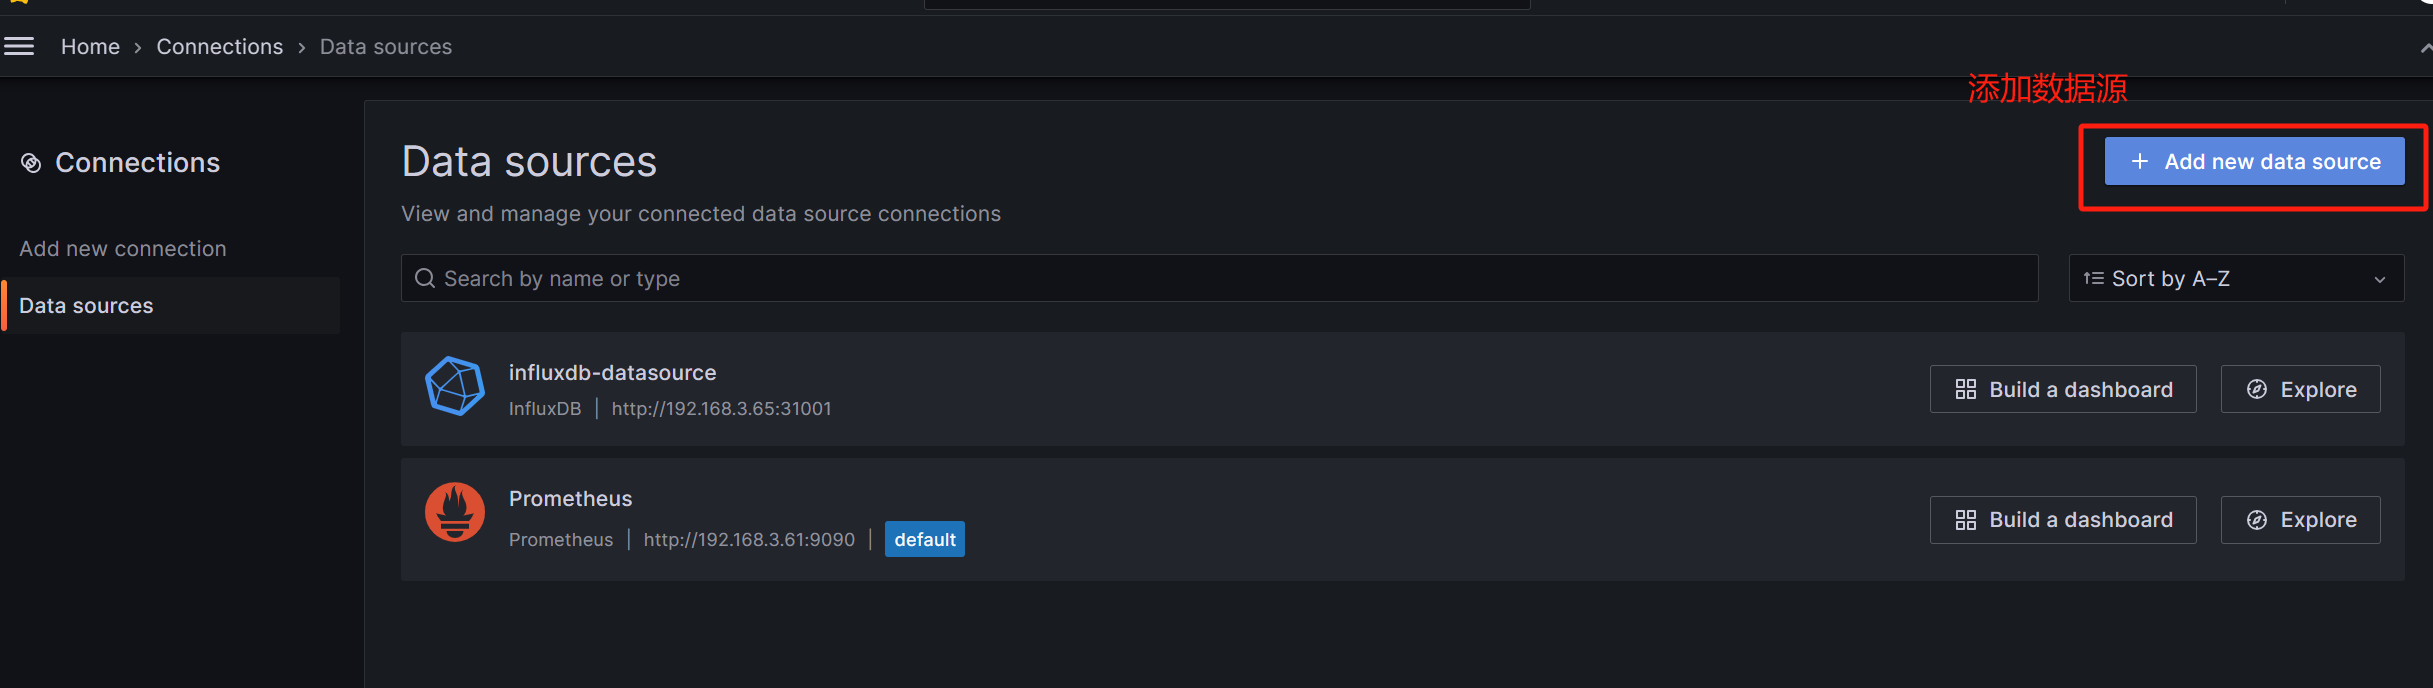
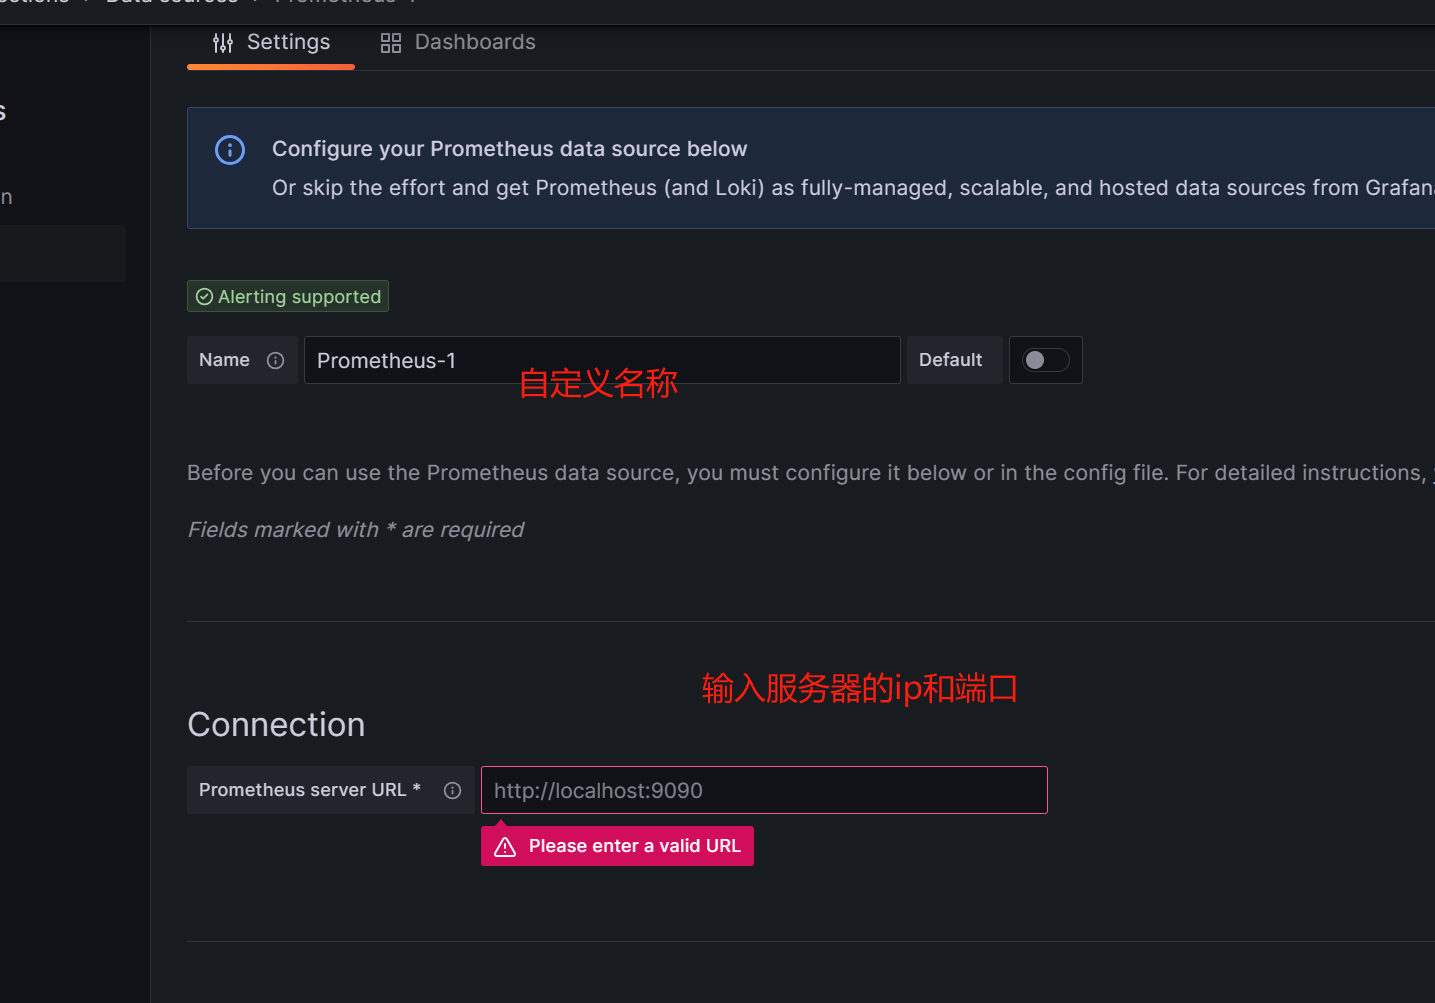
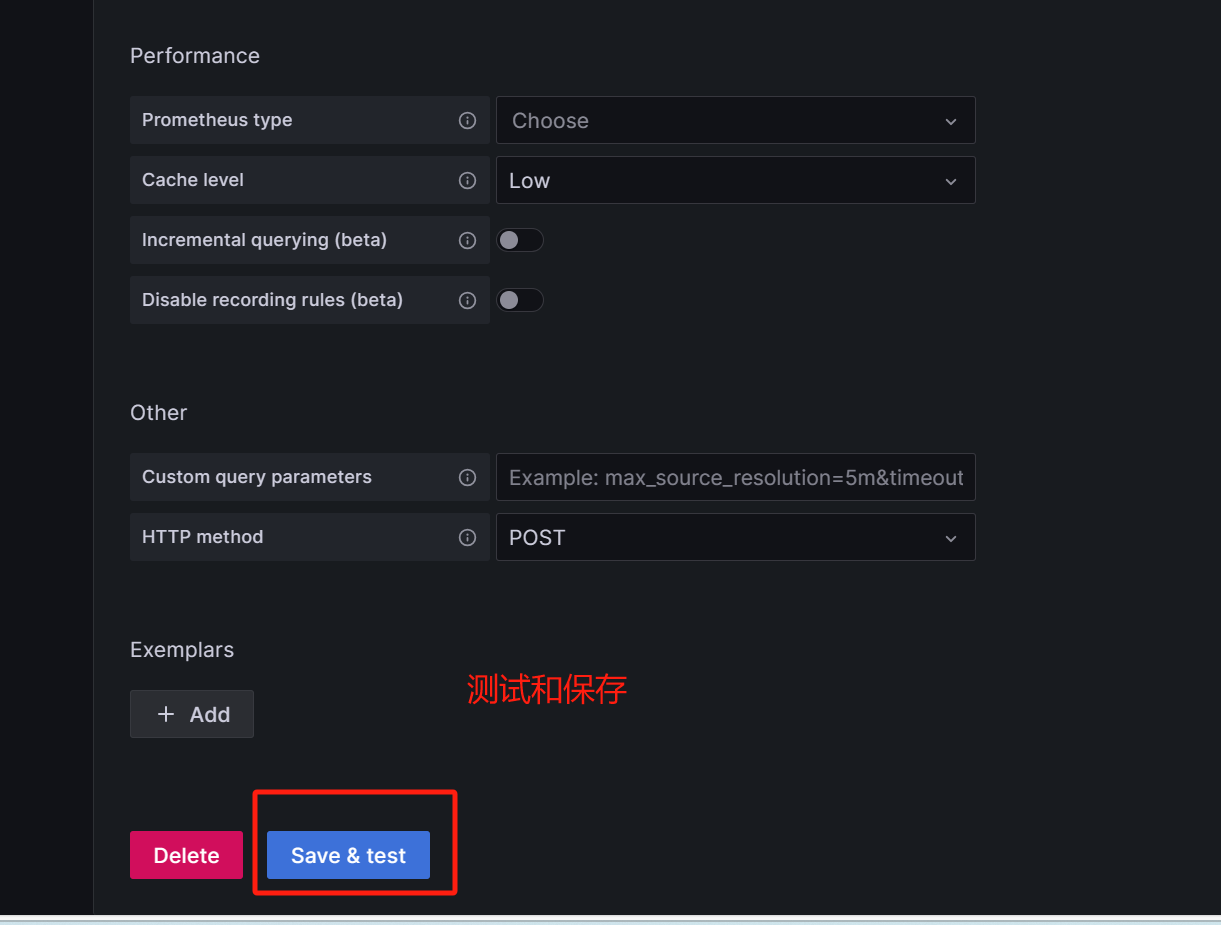
设置promtheus数据源
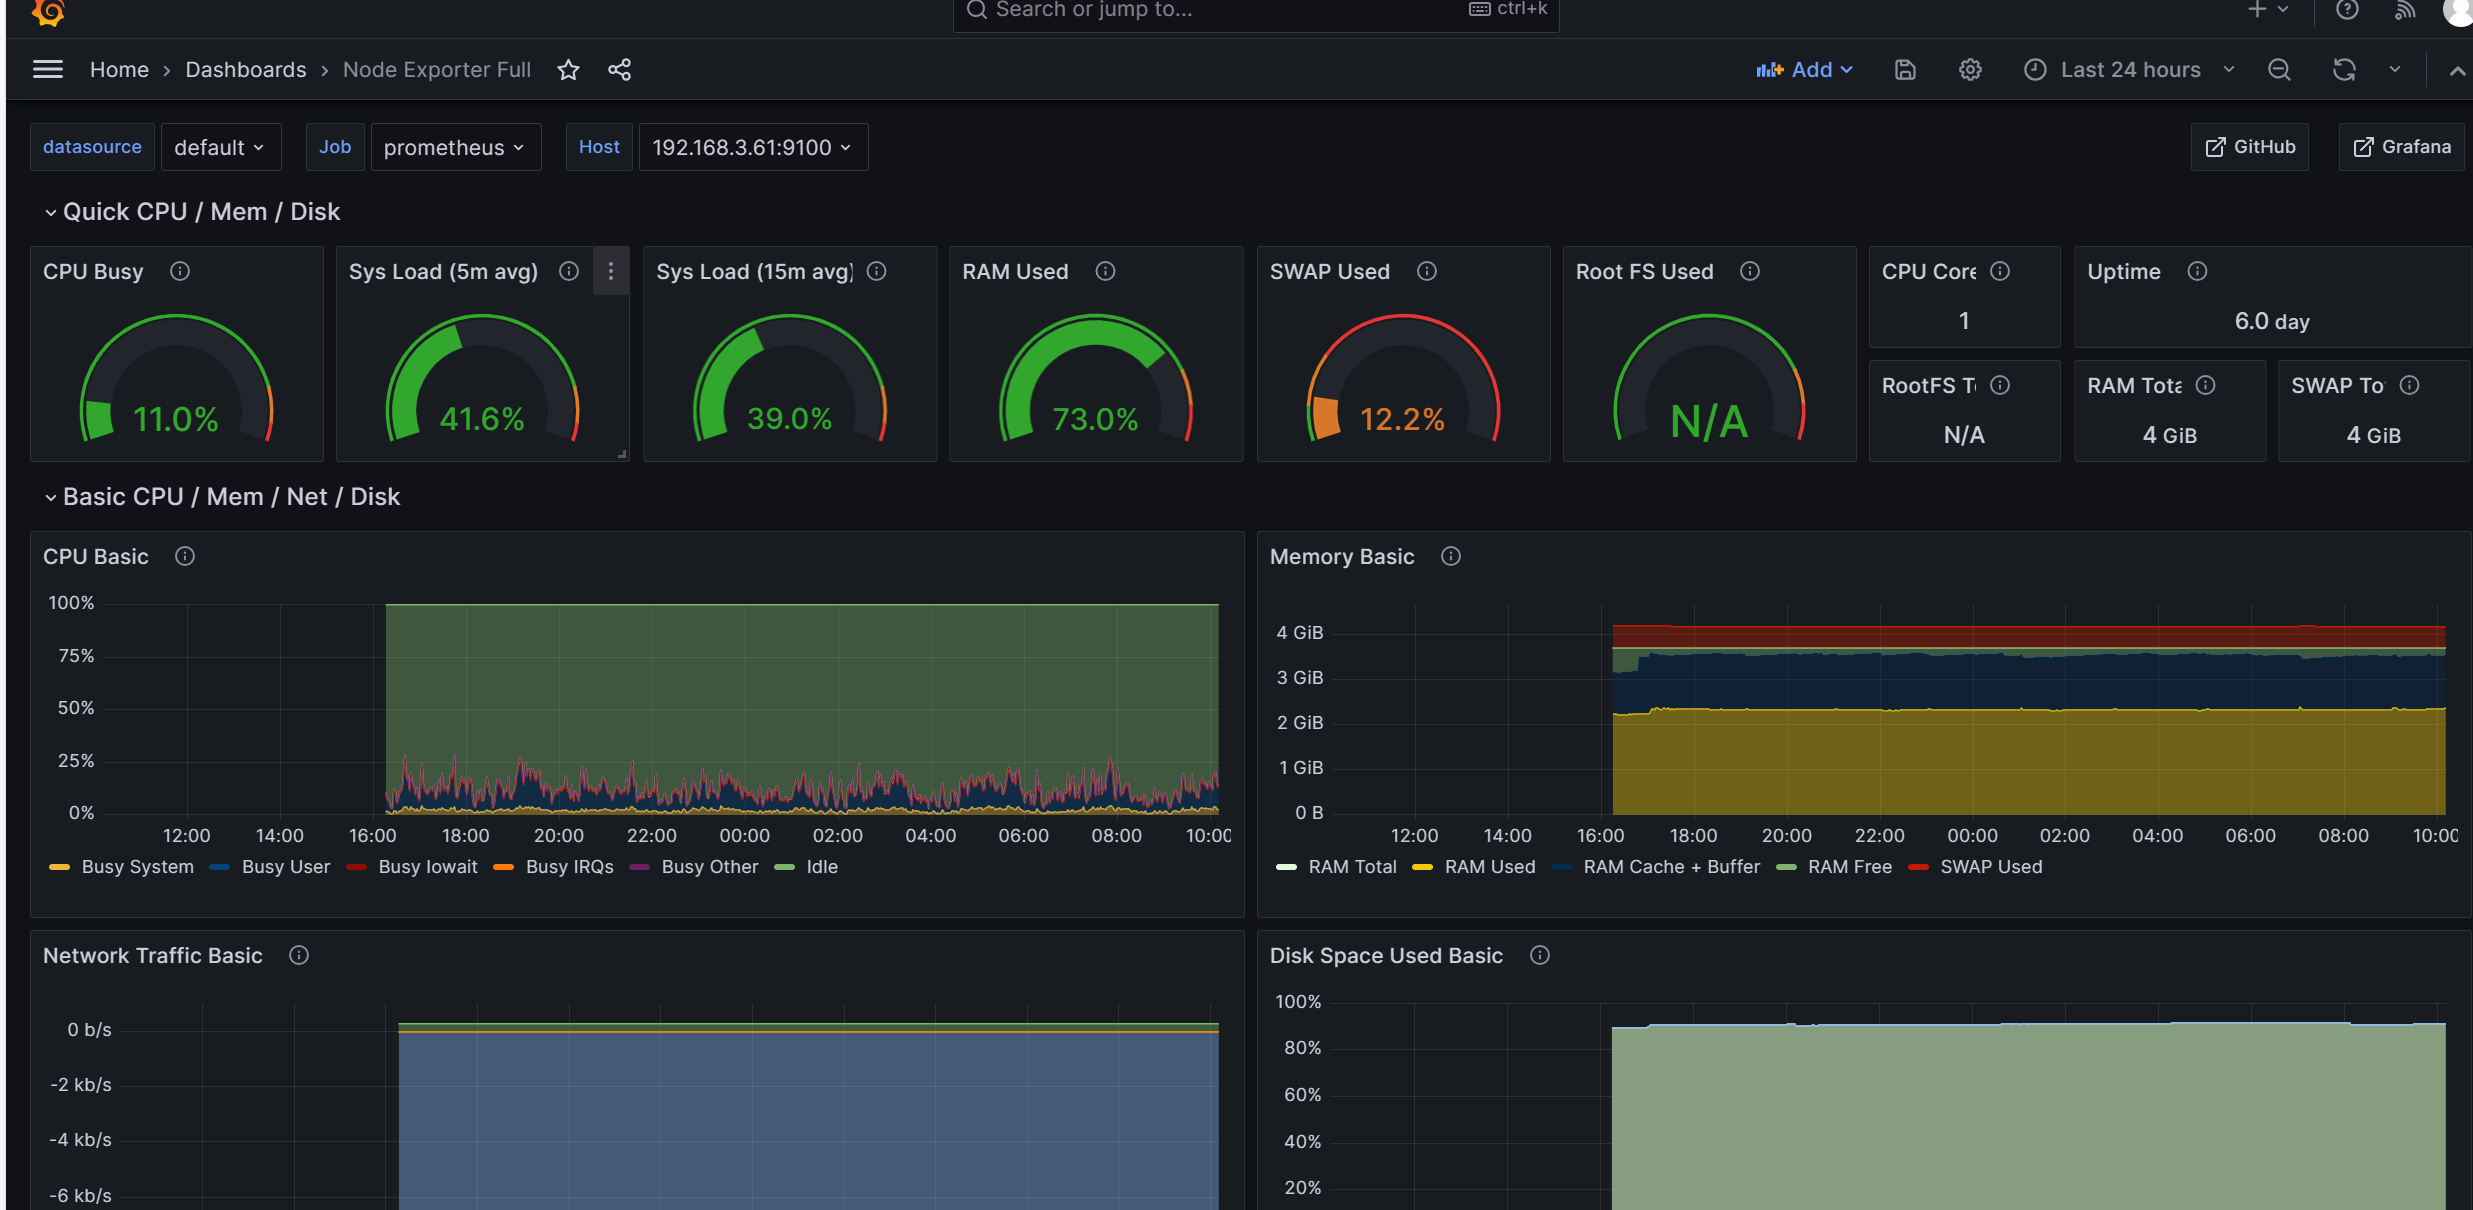
安装node_export监控模板
下载node_export监控模板
下载地址
https://grafana.com/grafana/dashboards/
下载最常用的node export
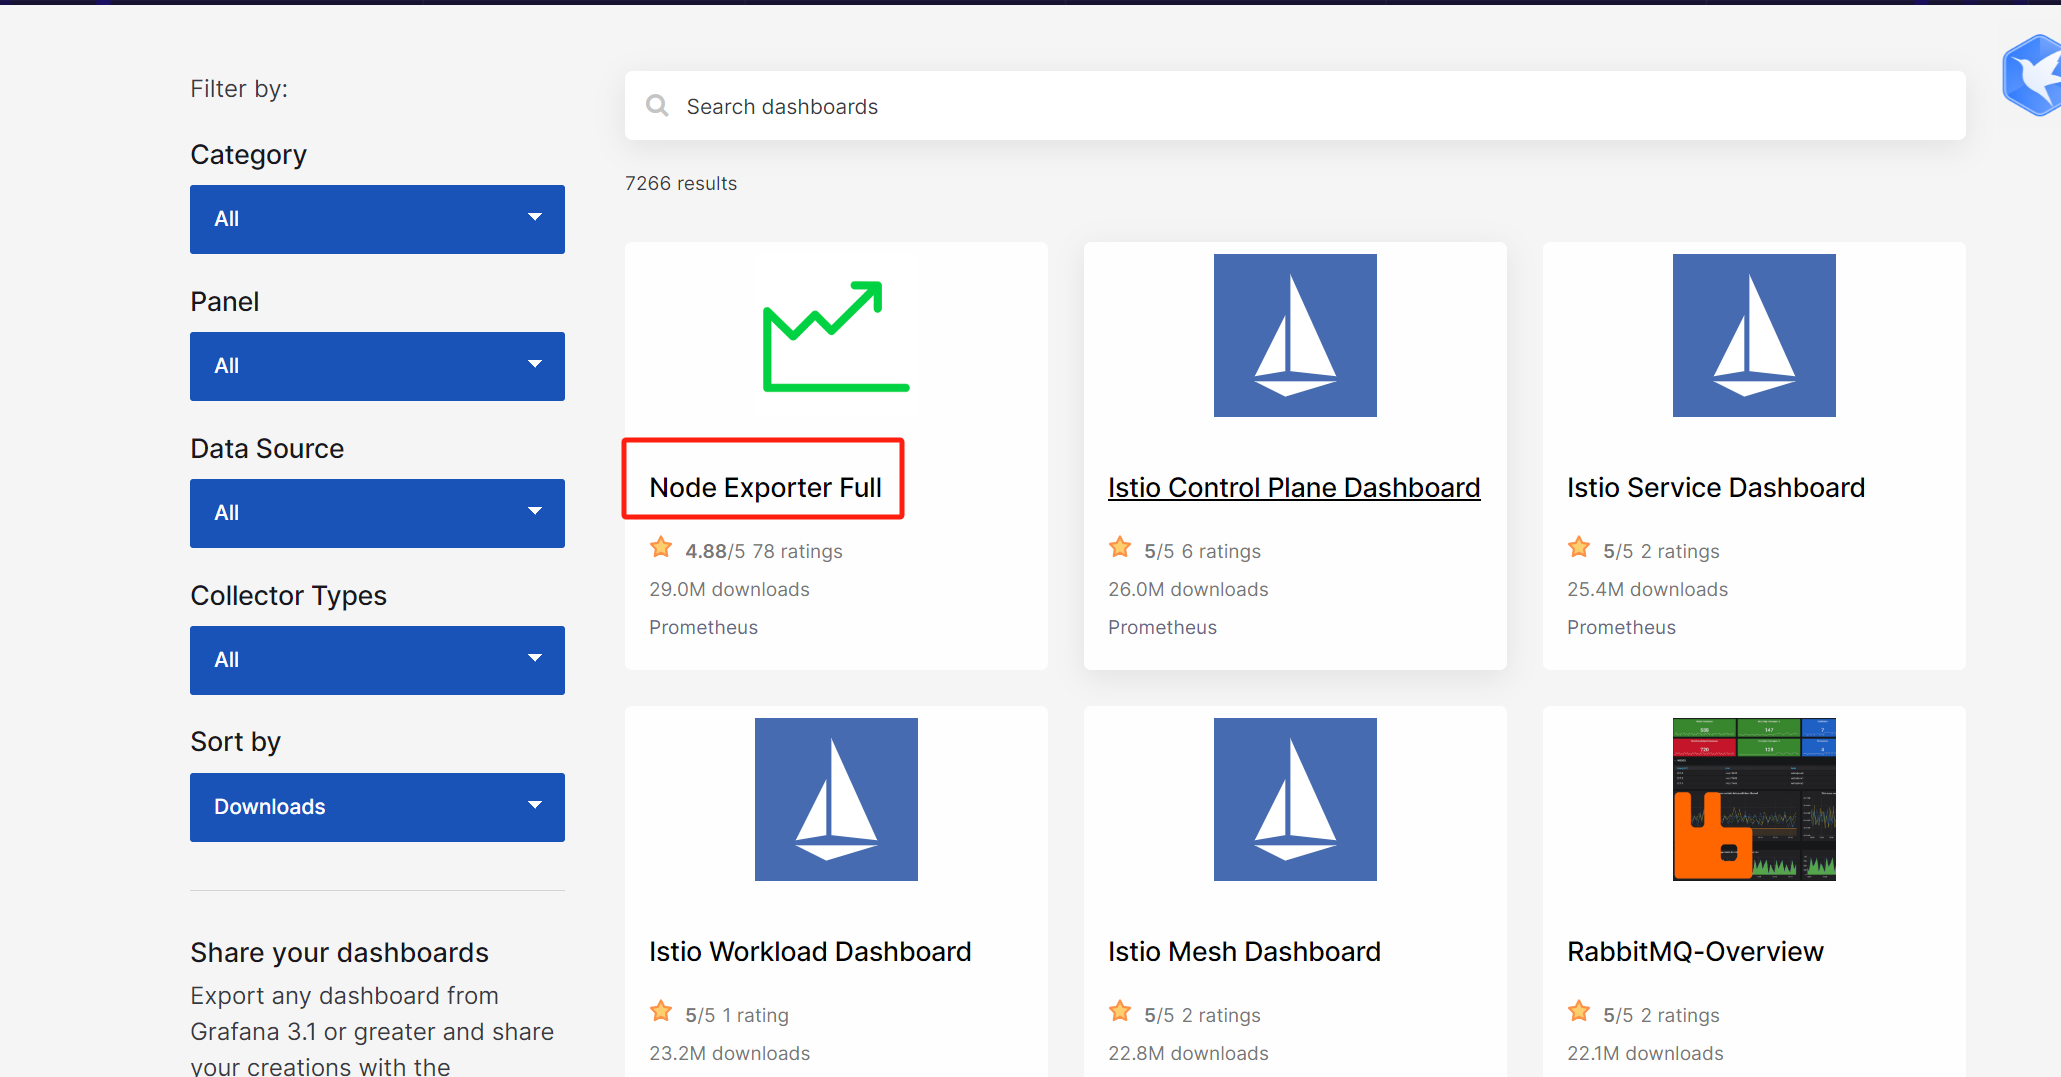
下载的是一个json文件
https://grafana.com/api/dashboards/1860/revisions/33/download
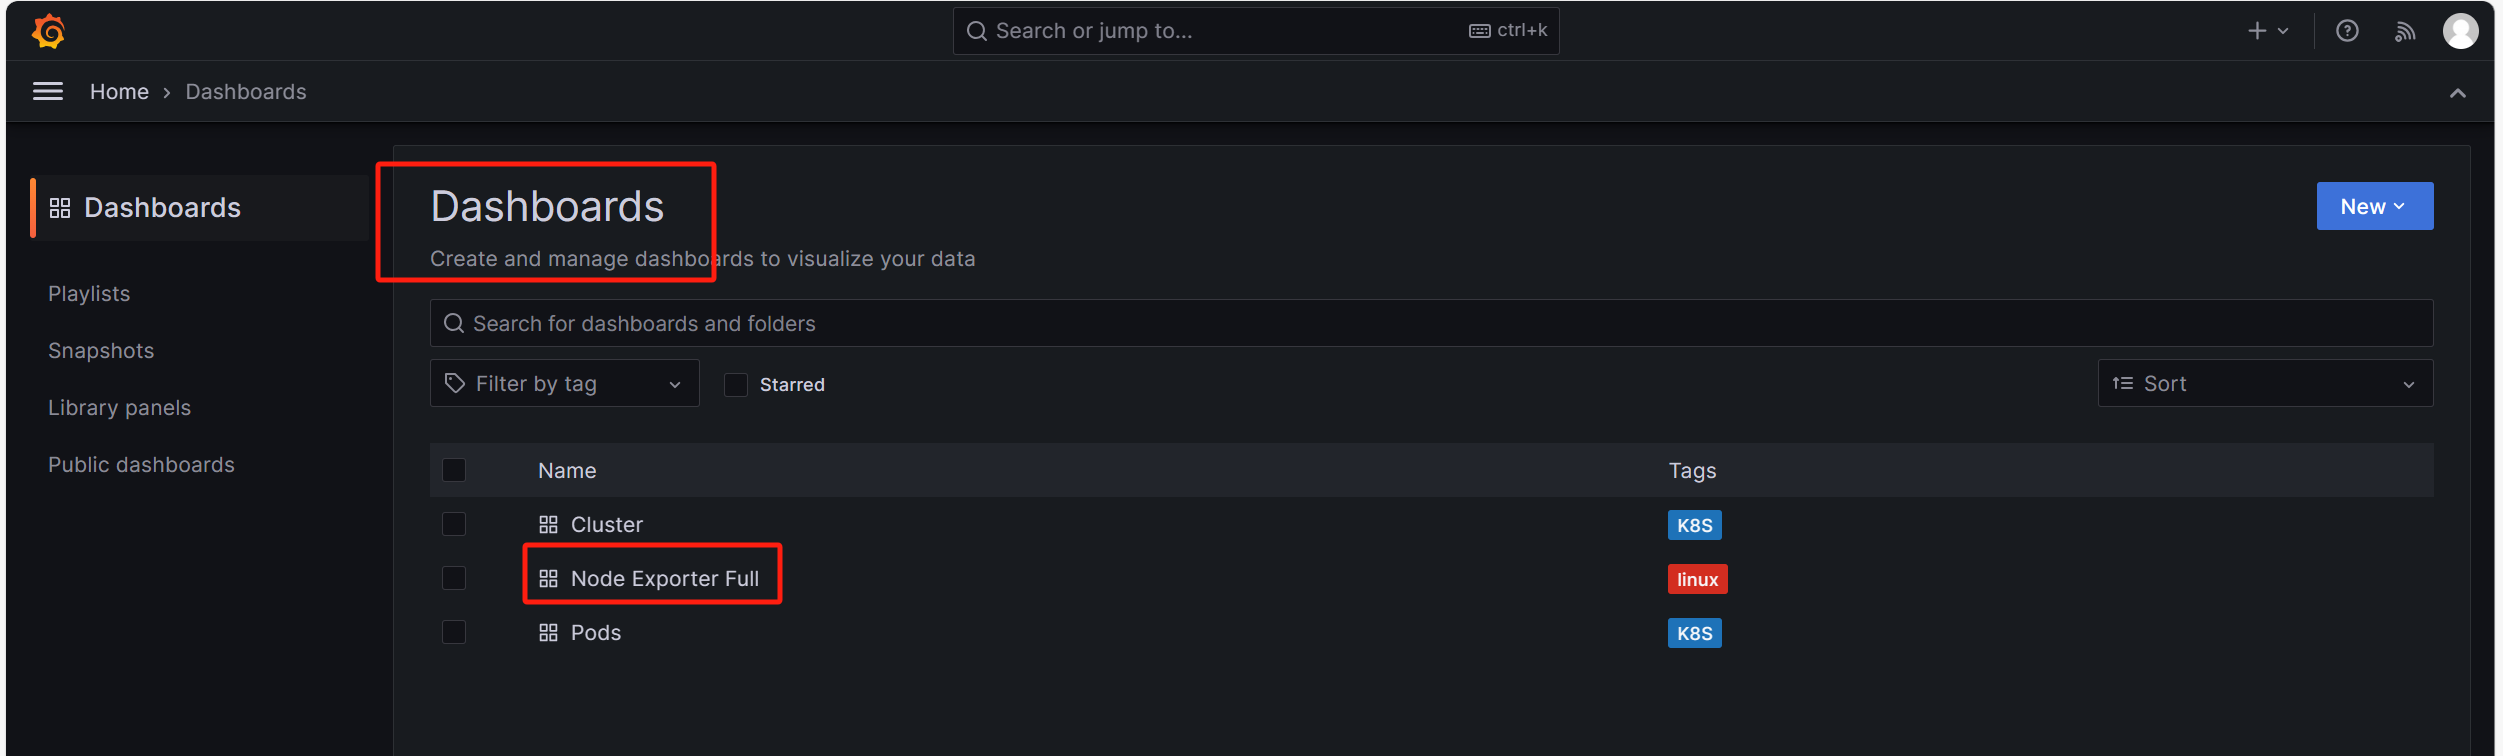
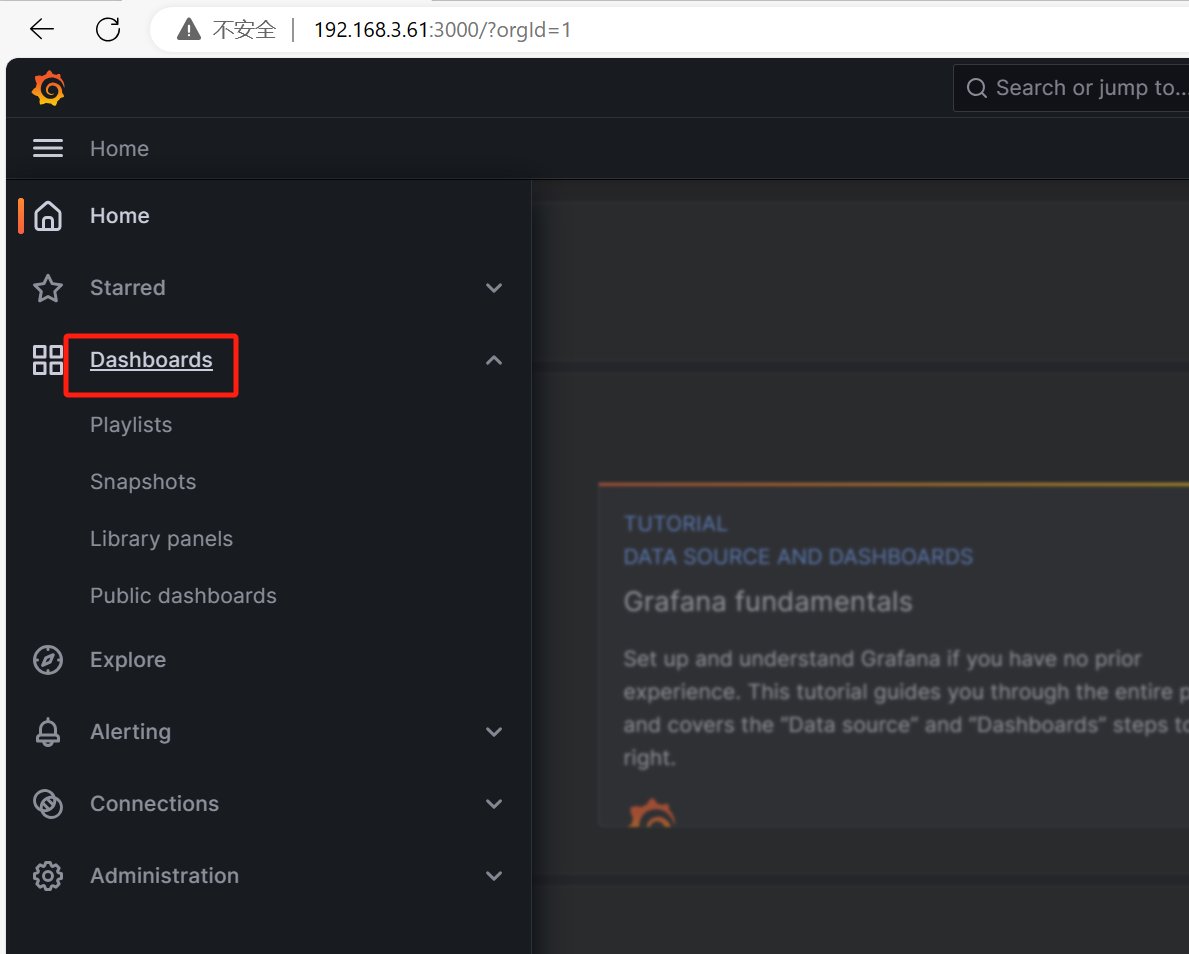
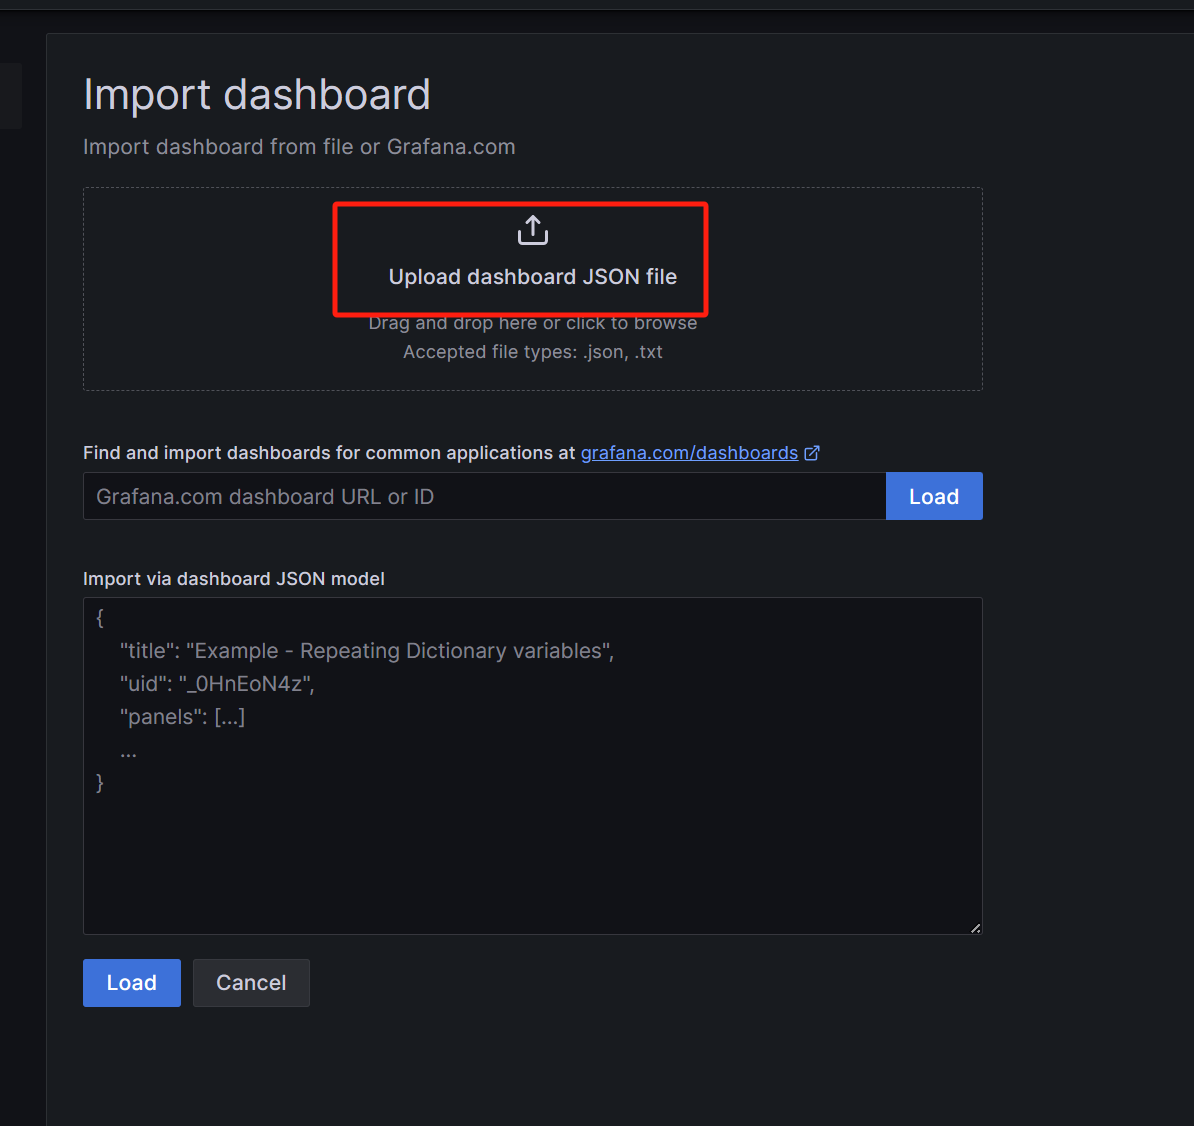
导入模板
登录Grafana导入模板
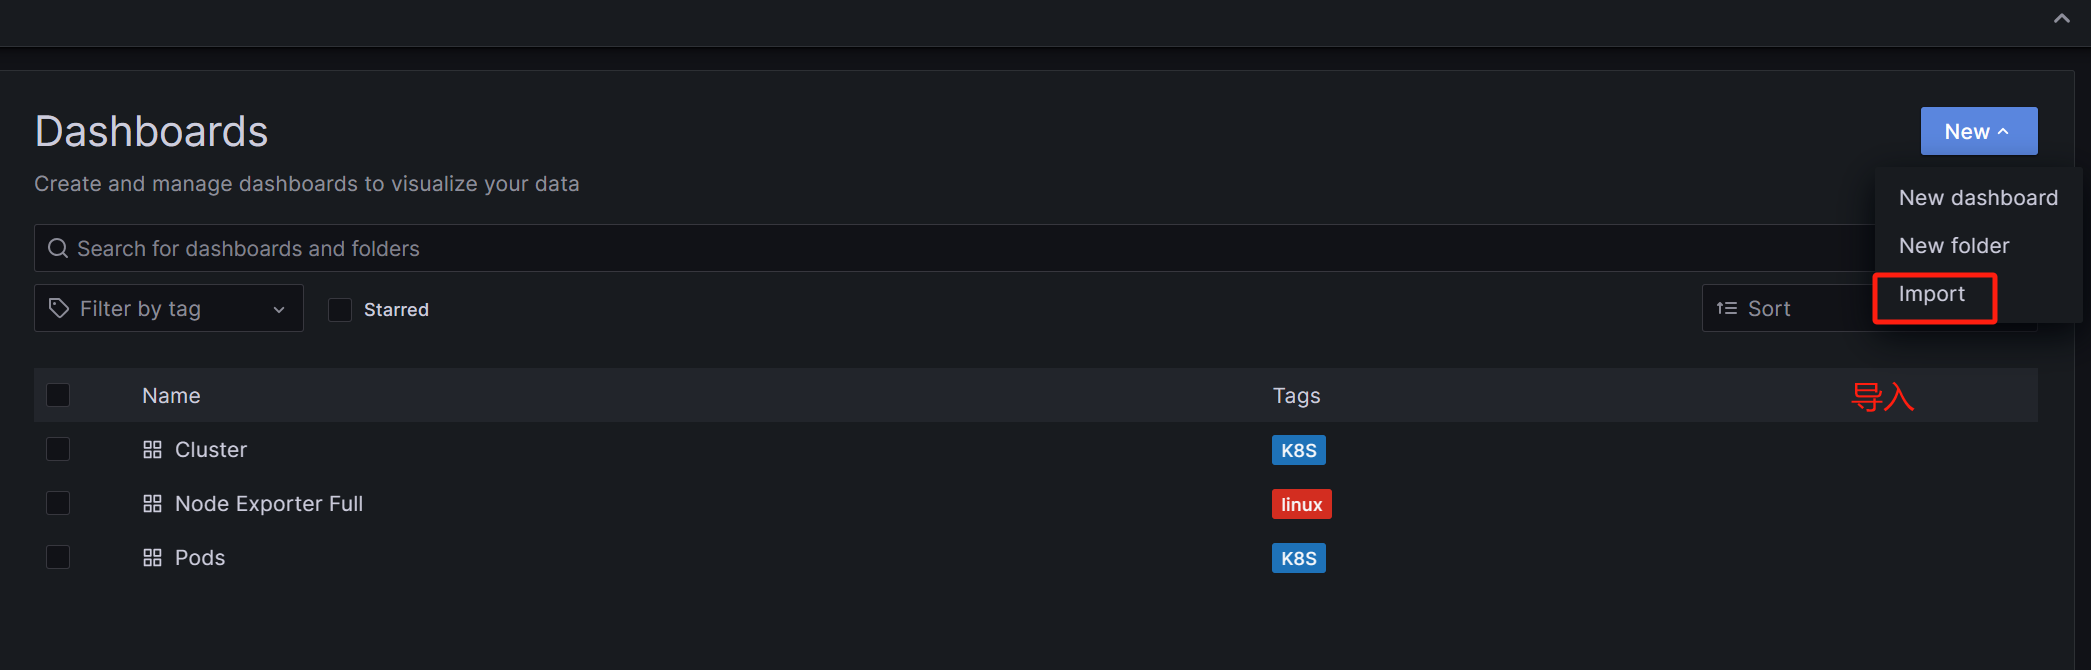
选择刚刚下载的模板导入即可
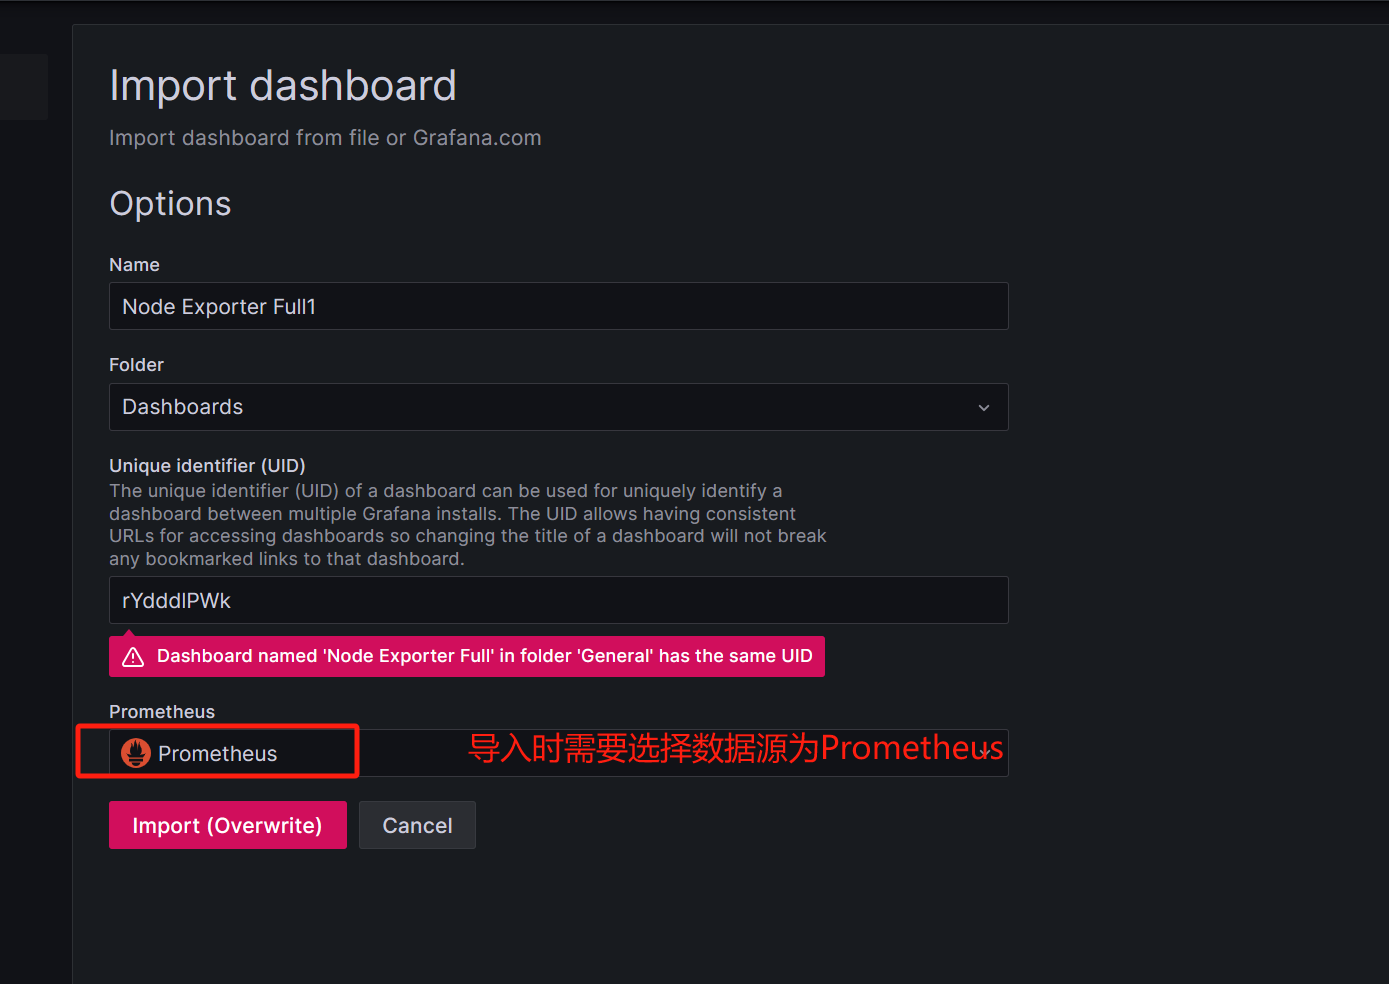
导入后查看