001、加载R包
library(tidyverse)
library(ggplot2)
library(viridis)
02、生成基本图形
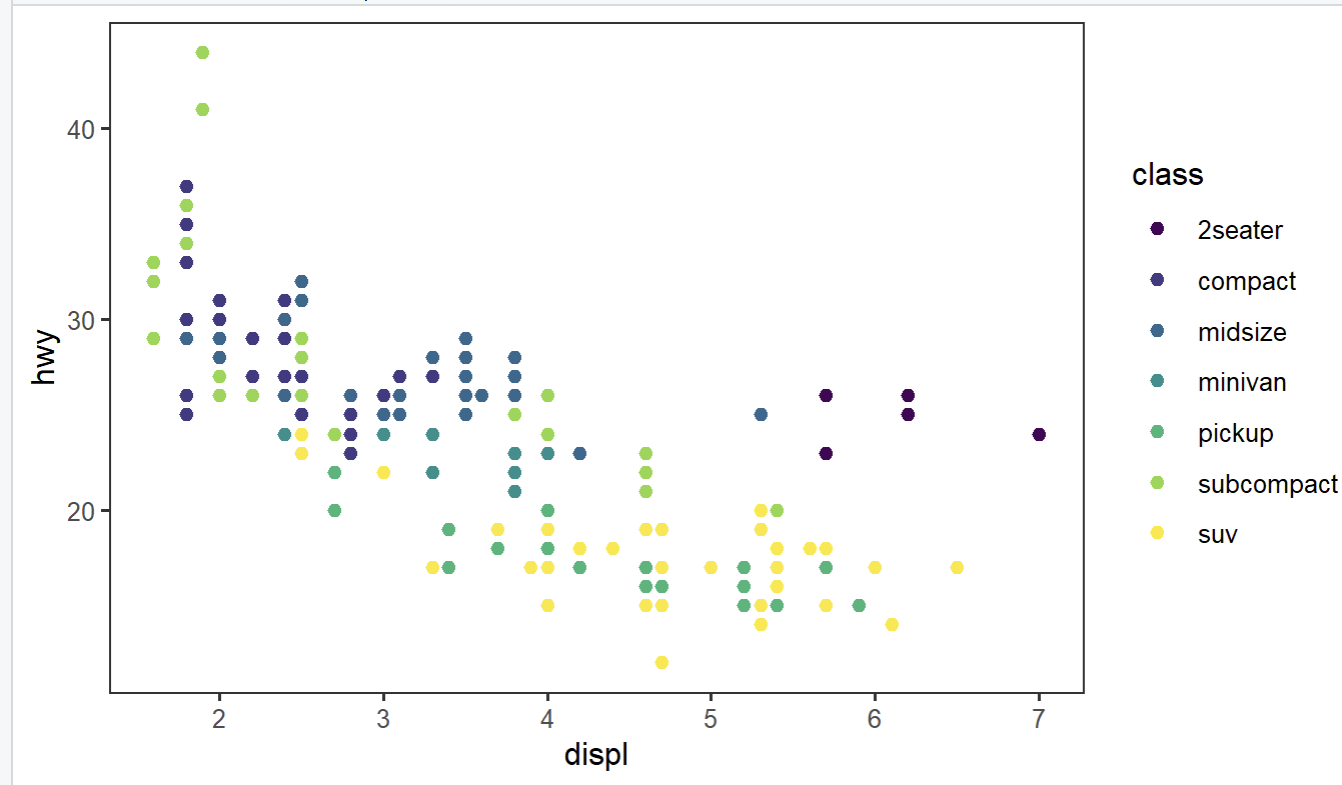
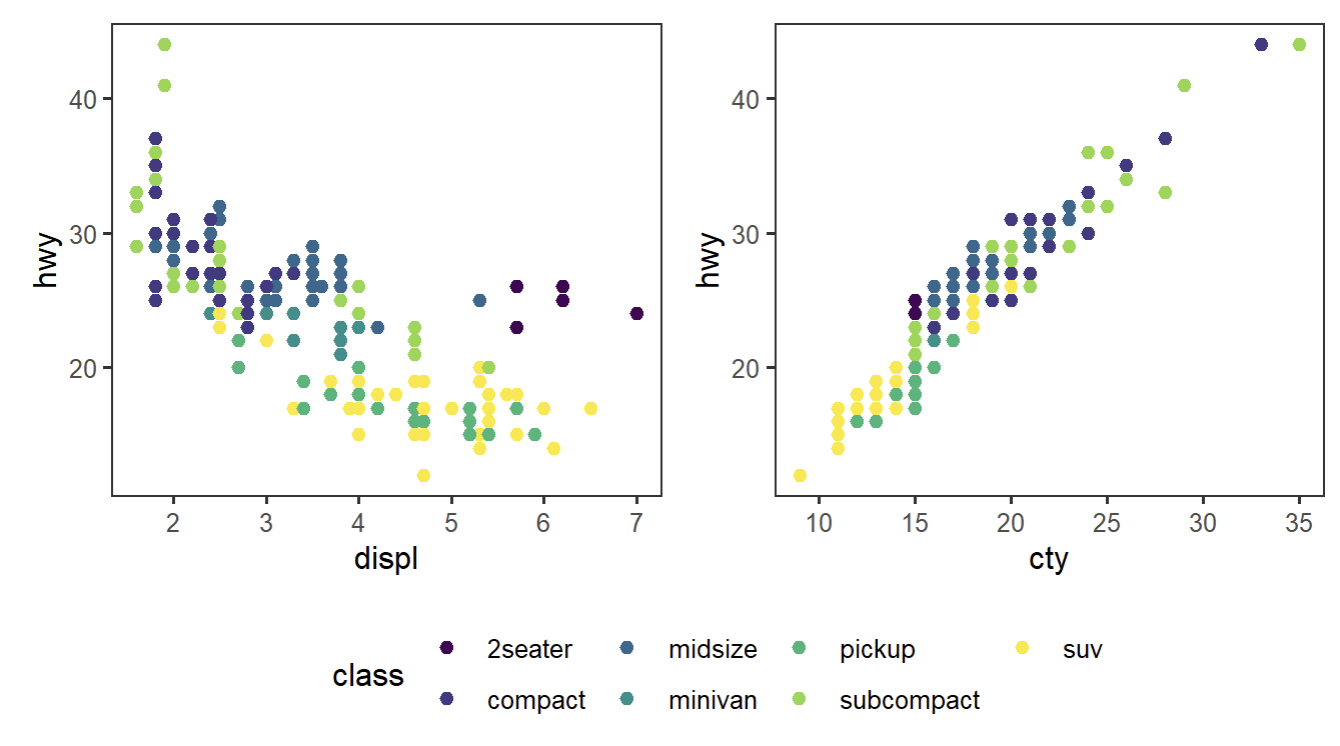
plot1 <- ggplot(data = mpg, aes(x = displ, y = hwy, color = class)) +
  geom_point(size=1.7) + scale_color_viridis(discrete = T) +
  theme_bw() + theme(panel.grid = element_blank())
plot1
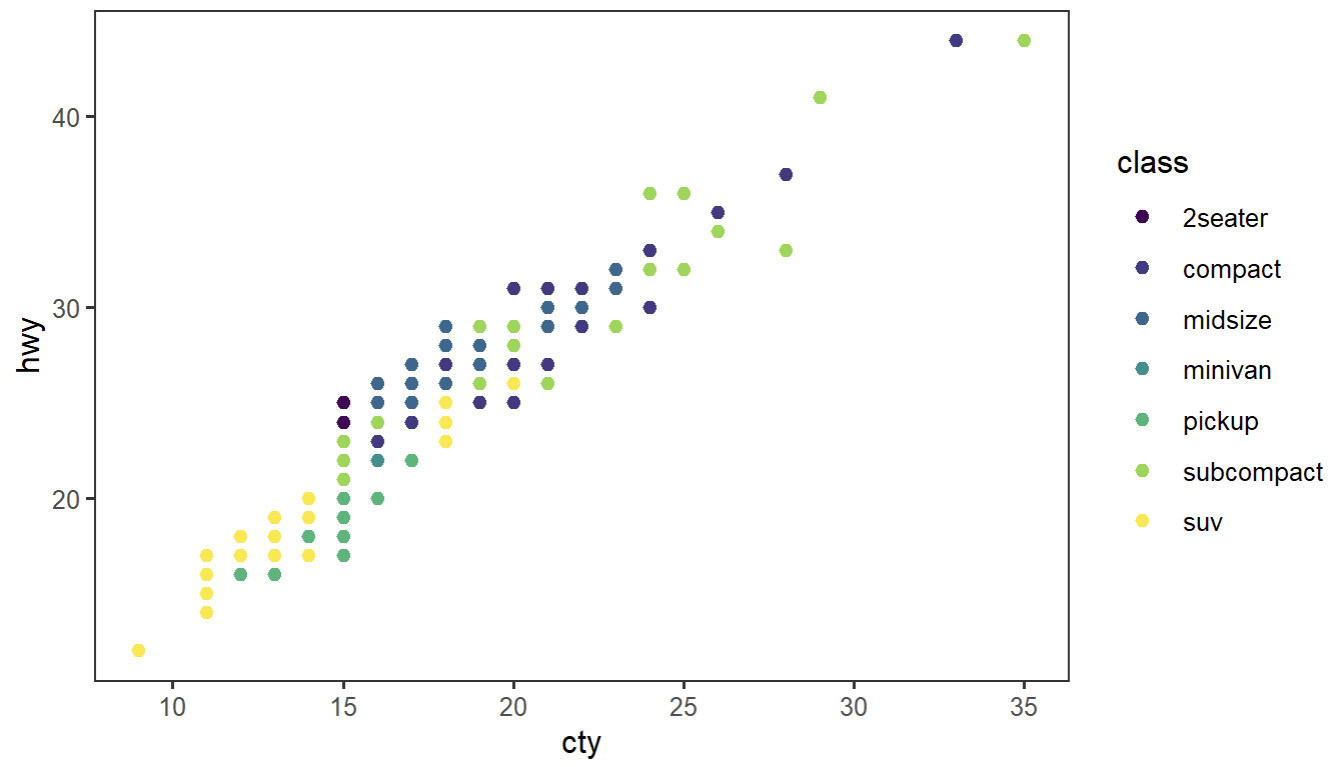
plot2 <- ggplot(data = mpg, aes(x = cty, y = hwy, color = class)) +
  geom_point(size=1.7) + scale_color_viridis(discrete = T) +
  theme_bw() + theme(panel.grid = element_blank())
plot2
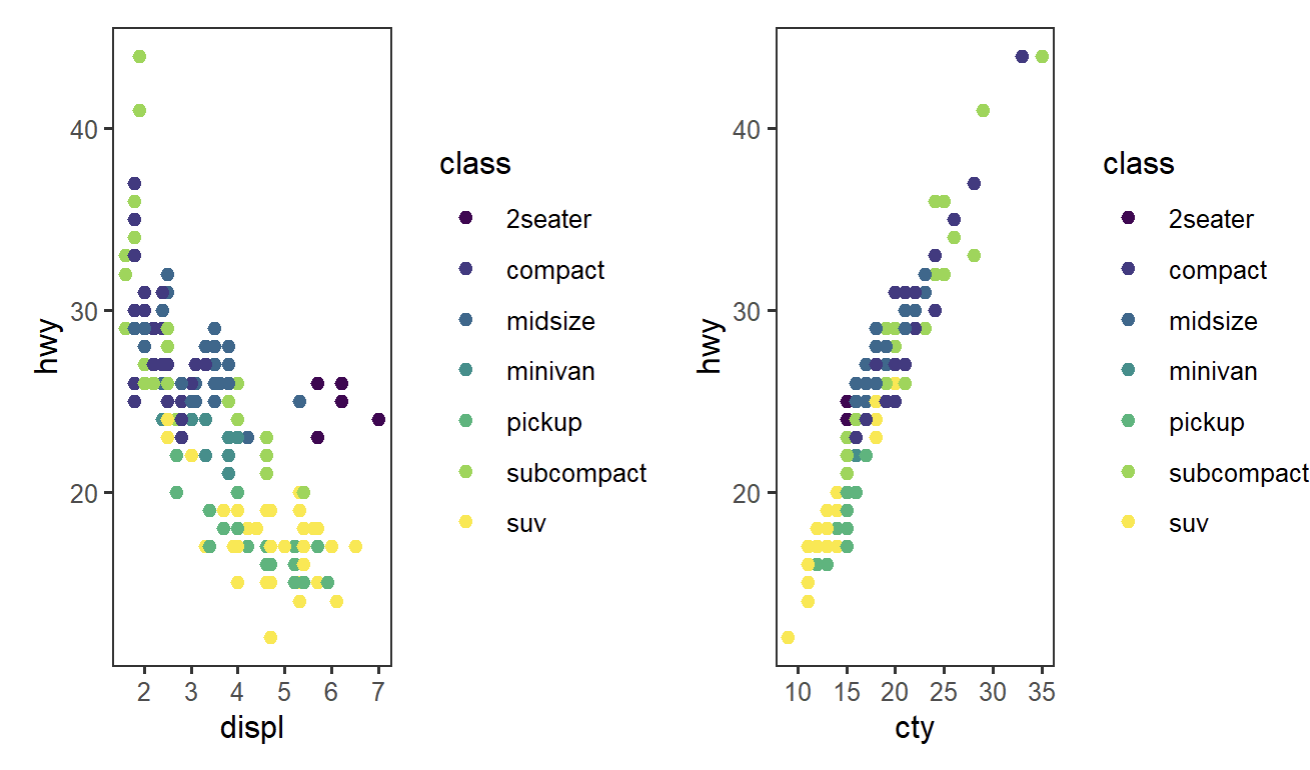
03、测试合并
library(patchwork)
plot1 + plot2
04、共享图例方法1
library(ggpubr)
ggarrange(plot1, plot2, common.legend = TRUE, legend="top")

05、共享图例方法2
library(cowplot)
combined_plot <- plot_grid(plot1 + theme(legend.position = 'none'), plot2 + theme(legend.position = 'none'), ncol = 2)
plot_grid(combined_plot, get_legend(plot1),rel_widths = c(4, 1))

06、共享图例方法3
library(patchwork)
plot1 + plot2 + plot_layout(guides = "collect") &
  theme(legend.position='bottom')
。
来源:
https://mp.weixin.qq.com/s?__biz=MzI1NjUwMjQxMQ==&mid=2247518331&idx=1&sn=2a606472b315af836abd42e021dcbd94&chksm=ea27779fdd50fe896b437eab8638cf00c14b926c2c869d243c5f062ca9a2dc6f0bcad6c39da8&mpshare=1&scene=23&srcid=0814BpZmDbF6mvC223hzCEwF&sharer_sharetime=1692028818190&sharer_shareid=50b75c6a886e09824b582fb782a7678b#rd