学习过程中跟着敲的代码:
import matplotlib.pyplot as plt
from matplotlib.image import imread
plt.rcParams["font.sans-serif"] = ['Arial Unicode MS'] # 设置字体
# plt.rcParams["axes.unicode_minus"] = False # 该语句解决图像中的“-”负号的乱码问题
# x = np.arange(-np.pi, np.pi, 0.1) # 以0.1为单位生成0到6之间的数据
# y1 = np.sin(x) # x传入生成y
# y2 = np.cos(x)
# plt.plot(x, y1, label="sin") # x,y传入生成函数图像
# plt.plot(x, y2, label="cos", color="red", linestyle="--") # x,y传入生成函数图像
# plt.xlabel = "x"
# plt.ylabel = "y"
# plt.title("sin&cos")
# plt.legend()
# plt.show()
# data_list = [1, 2, 3, 4]
# stock1 = [4, 6, 2, 3]
# stock2 = [1, 5, 3, 7]
# # 设置折线图的格式
# #显示样式
# # r.- go-- k+-. c*: bs format=颜色+点+线
# plt.plot(data_list, stock1, "ro--", label="股票代码:abc") # r是红色,o是图标类型
# plt.plot(data_list, stock2, "c*--", label="股票代码:123")
# plt.title("折线图") # 标题
# plt.xlabel("时间") # 标注x轴
# plt.ylabel("股价") # 标注y轴
# # 设置x/y坐标刻度
# # plt.xticks([1,2,3,4])
# plt.xticks(np.arange(1, 5, 0.5))
# plt.yticks(np.arange(2, 8, 1))
# plt.legend()
# # 添加辅助线网格
# plt.grid()
# plt.show()
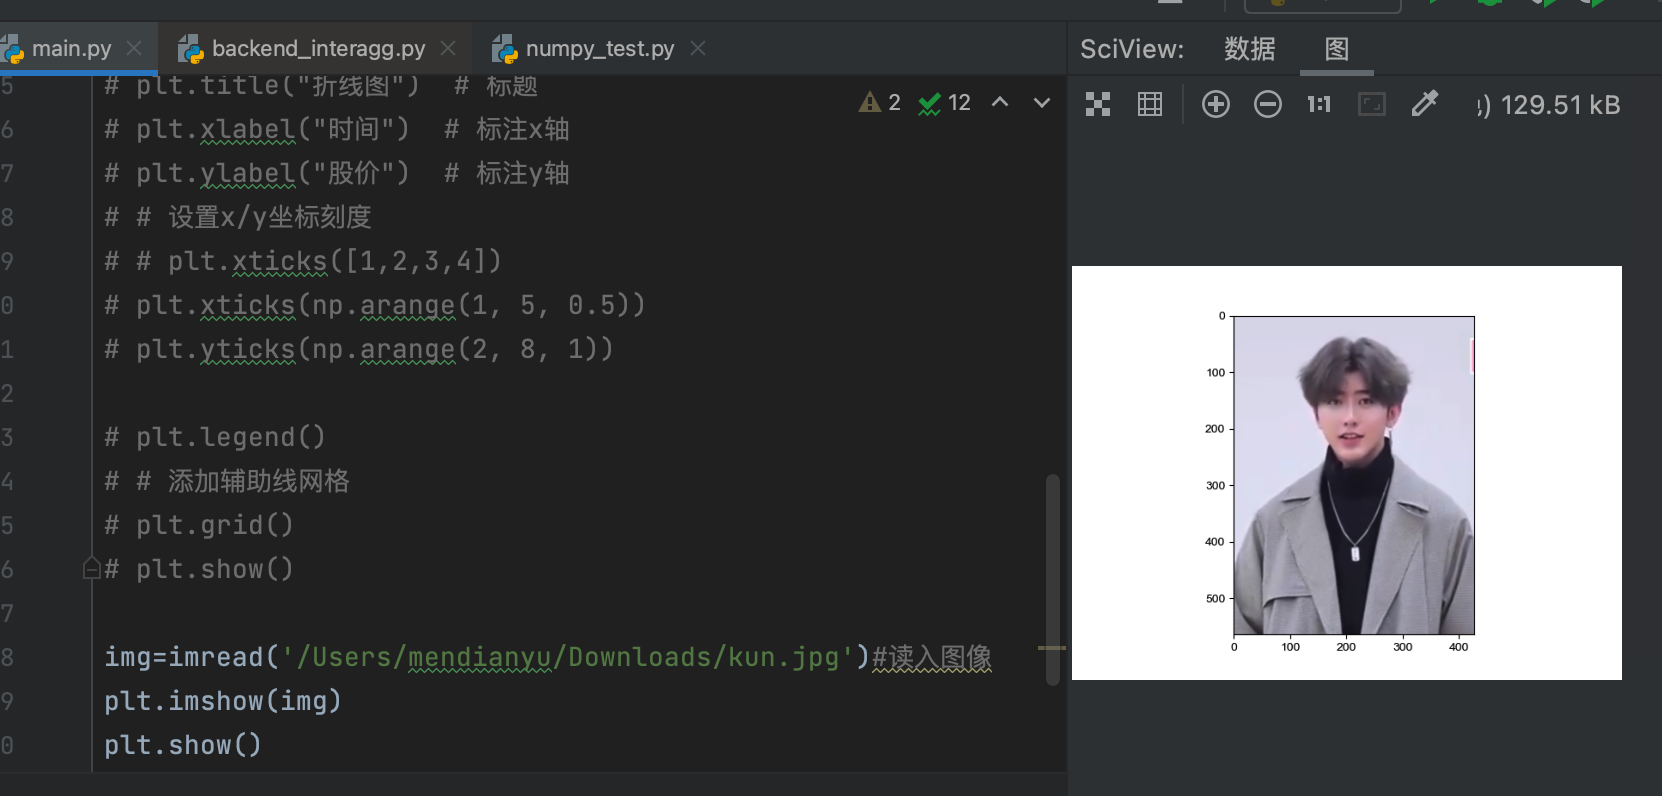
img=imread('/Users/mendianyu/Downloads/kun.jpg')#读入图像
plt.imshow(img)
plt.show()
更多参考:Matplotlib documentation — Matplotlib 3.7.1 documentation