import numpy as np
import matplotlib.pyplot as plt
from scipy.interpolate import CubicSpline
# 样本数据点(4.0,4.2),(4.3,5.7),(4.6,6,6),(5.3,4.8),(5.9,4,6)
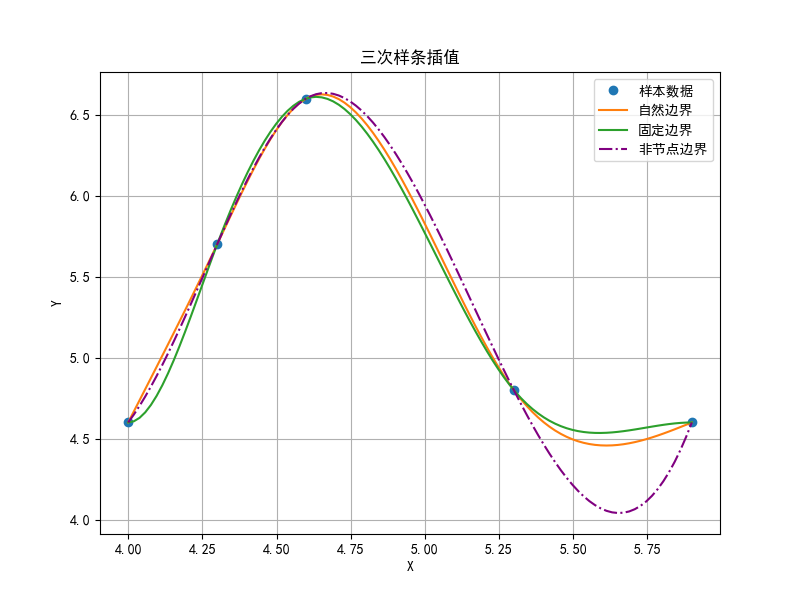
x = np.array([4.0, 4.3, 4.6, 5.3, 5.9])
y = np.array([4.2, 5.7, 6.6, 4.8, 4.6])
# 确保第一个和最后一个数据点的y值相等,以满足周期边界条件
y[0] = y[-1]
# 创建三次样条插值对象
cs_natural = CubicSpline(x, y, bc_type='natural') # 自然边界
cs_clamped = CubicSpline(x, y, bc_type='clamped') # 固定边界
cs_not_a_knot = CubicSpline(x, y, bc_type='not-a-knot') # 非节点边界条件
# 生成插值点
x_interp = np.linspace(4.0, 5.9, 100)
y_natural = cs_natural(x_interp)
y_clamped = cs_clamped(x_interp)
y_not_a_knot = cs_not_a_knot(x_interp)
plt.rcParams['font.sans-serif'] = ['SimHei'] # 设置字体为中文黑体
plt.rcParams['axes.unicode_minus'] = False # 解决负号显示为方块的问题
# 绘制图形
plt.figure(figsize=(8, 6))
plt.plot(x, y, 'o', label='样本数据')
plt.plot(x_interp, y_natural, label='自然边界')
plt.plot(x_interp, y_clamped, label='固定边界')
plt.plot(x_interp, y_not_a_knot, label='非节点边界')
plt.legend()
plt.xlabel('X')
plt.ylabel('Y')
plt.title('三次样条插值')
plt.grid(True)
plt.show()