一、数据说明
1、背景介绍
21世纪是人类追求健康的世纪;21世纪是人人享有保健的新时代。健康是人生最宝贵的财富! 没有健康的身心一切无从谈起。随着经济发展和人们生活水平的迅速提高,人们在尽情享受现代文明成果的同时,生活条件提高了,可食品安全和环境卫生问题却层出不穷,生活质量反而不断下降了。本课题通过对健康检查报告的分析,利用python相关第三方库实现对数据集的处理与分析与BIM有关的因素,探索走上健康之路的方法。
2、数据内容
数据集相关说明:
|
字段名称 |
字段类型 |
字段说明 |
|
Unnamed: 0 |
整型 |
序号。 |
|
id |
整型 |
ID。 |
|
age |
整型 |
年龄。 |
|
gender |
整型 |
性别。 |
|
height |
整型 |
身高。 |
|
weight |
浮点型 |
体重。 |
|
ap_hi |
整型 |
血压-高值。 |
|
ap_lo |
整型 |
血压-低值。 |
|
cholesterol |
整型 |
胆固醇。 |
|
gluc |
整型 |
葡萄糖。 |
|
smoke |
整型 |
抽烟。 |
|
alco |
整型 |
饮酒。 |
|
active |
整型 |
积极的。 |
|
cardio |
整型 |
有氧运动。 |
|
AgeinYr |
整型 |
年龄。 |
|
BMI |
浮点型 |
体重指数。 |
|
BMICat |
字符型 |
体重指数分类。 |
|
AgeGroup |
字符型 |
年龄分组。 |
2、数据来源
本数据集来着:爱数科(网站:http://www.idatascience.cn/dataset)
该数据集基于一般医疗保健检查,包含血压、BMI 和葡萄糖数据。
二、数据可视化分析
1、导入数据集
import pandas as pd
from datetime import datetime
data=pd.DataFrame(pd.read_csv(r'健康检查.csv'))
data

2、数据清洗
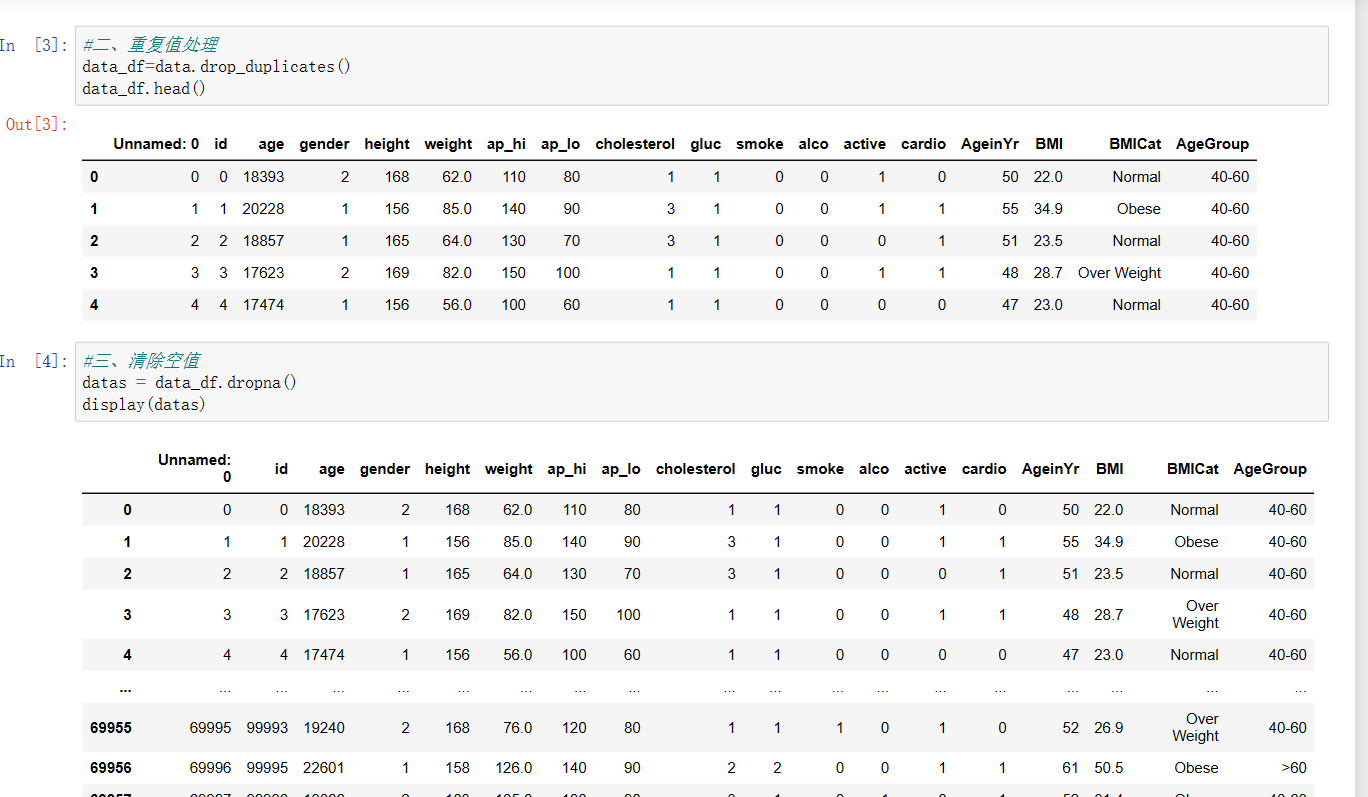
重复值处理和清除空值
#重复值处理
data_df=data.drop_duplicates()
data_df.head()
#清除空值
datas = data_df.dropna()
display(datas)
3、查看是否还有NAN值
data.isna().any()

4、删除无效列(id对分析结果没有影响)
datas.drop('id',axis=1,inplace=True)
datas.drop('Unnamed: 0',axis=1,inplace=True)
datas

5、数据分析:
查看每栏的统计
异常值处理
#查看每栏的统计
datas.describe()
#异常值处理
datas.replace([298.700000],datas['BMI'].mean())
datas.replace([11000.000000],datas['ap_lo'].mean())

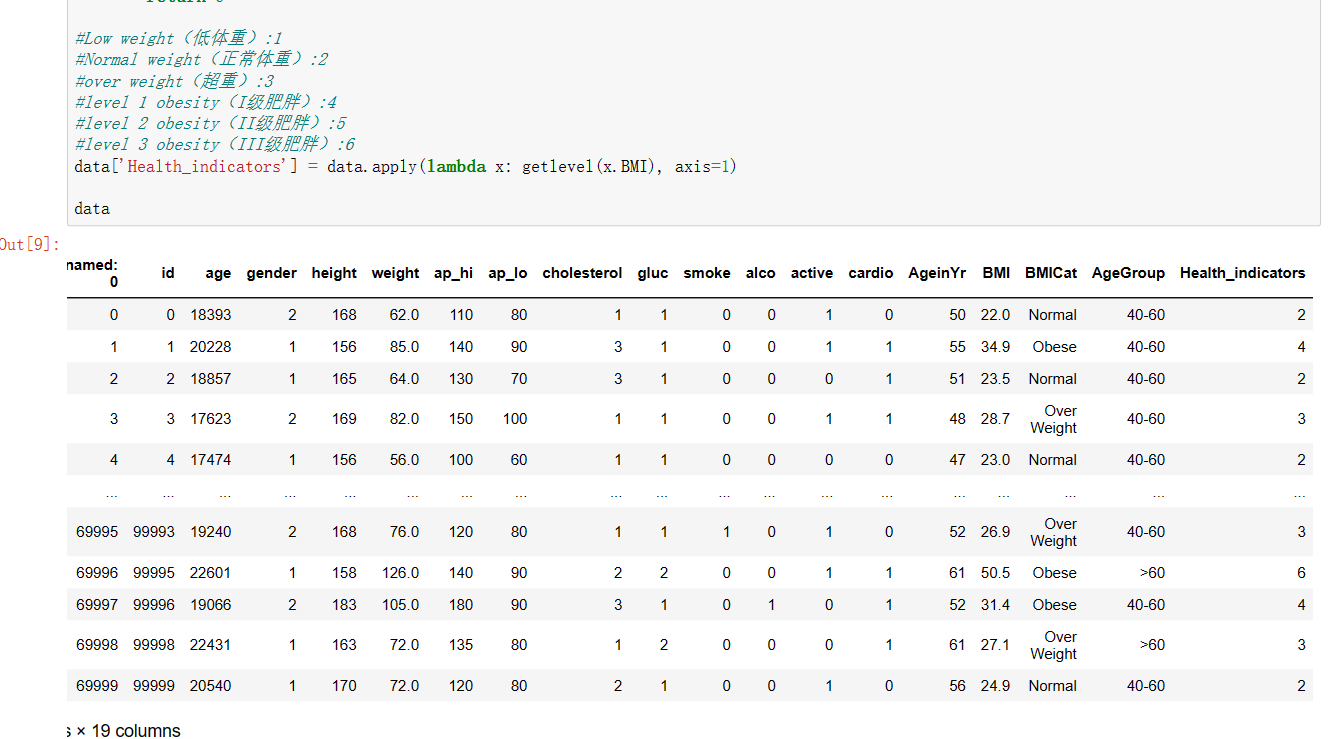
6、创建新的一列,名为:Health_indicators为后面做可视化提前准备(相关数值有做解释)
统计该列各个元素的个数
#创建新的一列,名为:Health_indicators为后面做可视化提前准备(相关数值有做解释)
def getlevel(BMI):
    if(BMI<18.5):
        return 1
    elif(18.5<=BMI<=24.9):
        return 2
    elif(25<=BMI<=29.9):
        return 3
    elif(30<=BMI<=34.9):
        return 4
    elif(35<=BMI<=39.9):
        return 5
    elif(40<=BMI):
        return 6

#Low weight(低体重):1
#Normal weight(正常体重):2
#over weight(超重):3
#level 1 obesity(I级肥胖):4
#level 2 obesity(II级肥胖):5
#level 3 obesity(III级肥胖):6
data['Health_indicators'] = data.apply(lambda x: getlevel(x.BMI), axis=1)

data

#统计该列各个元素的个数
a=list(data['Health_indicators']).count(1)
b=list(data['Health_indicators']).count(2)
c=list(data['Health_indicators']).count(3)
d=list(data['Health_indicators']).count(4)
e=list(data['Health_indicators']).count(5)
f=list(data['Health_indicators']).count(6)
print("低体重个数为:",a)
print("正常体重个数为:",b)
print("超重个数为:",c)
print("I级肥胖个数为:",d)
print("II级肥胖个数为:",e)
print("III级肥胖个数为:",f)

7、对该列进行数据科学化
#对该列进行数据科学化

import matplotlib.pyplot as plt

plt.rcParams['font.sans-serif']=['Microsoft YaHei']  #显示中文标签,处理中文乱码问题
plt.rcParams['axes.unicode_minus']=False  #坐标轴负号的处理
plt.axes(aspect='equal')  #将横、纵坐标轴标准化处理,确保饼图是一个正圆,否则为椭圆

edu = [a,b,c,d,e,f]
labels = ['低体重','正常体重','超重','I级肥胖','II级肥胖','III级肥胖']
colors = ['#9999ff', '#ff9999', '#7777aa', '#2442aa', '#dd5555','#FFFF00']

plt.pie(x=edu,  #绘图数据
        labels=labels,  #添加教育水平标签
        colors=colors,
        autopct='%.2f%%',  #百分比的格式
        pctdistance=0.8,  #百分比标签与圆心的距离
        labeldistance=1.1,  #教育水平标签与圆心的距离
        startangle=180,  #饼图的初始角度
        radius=1.2,  #饼图的半径
        counterclock=False,  #是否逆时针,这里设置为顺时针方向
        wedgeprops={'linewidth':1.5, 'edgecolor':'green'},  #饼图内外边界的属性值
        textprops={'fontsize':10, 'color':'black'},  #文本标签的属性值
        )

#添加图标题
plt.title('健康指标直观图')
#显示图形
plt.show()
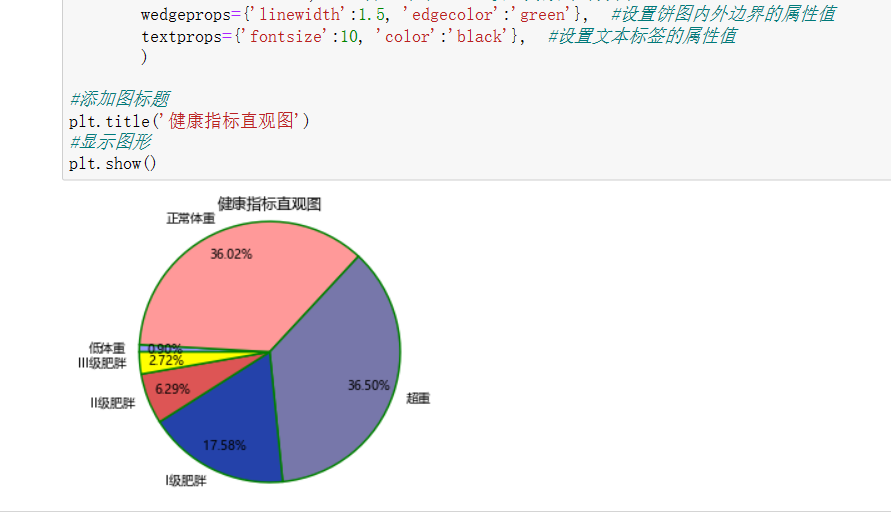
从上面这张饼图可以看出该数据集的人大多以正常体重和超重为主,少数人是以其他的指标为主。
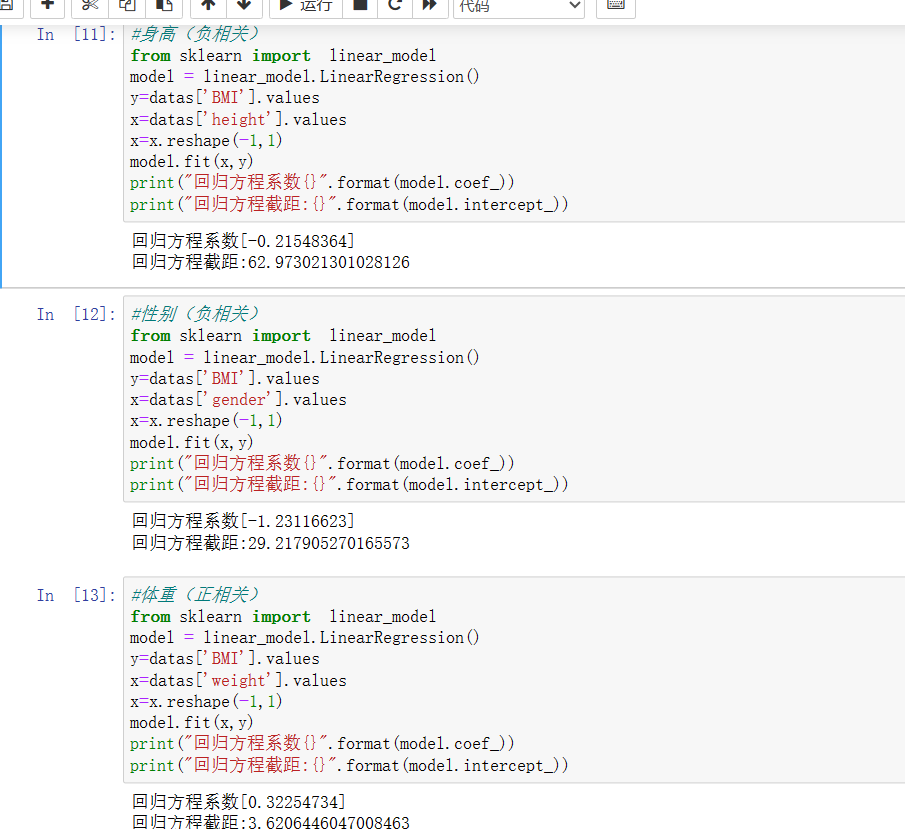
8、求各列与BMI列的回归方程系数
#身高(负相关)
from sklearn import  linear_model
model = linear_model.LinearRegression()
y=datas['BMI'].values
x=datas['height'].values
x=x.reshape(-1,1)
model.fit(x,y)
print("回归方程系数{}".format(model.coef_))
print("回归方程截距:{}".format(model.intercept_))

#性别(负相关)
from sklearn import  linear_model
model = linear_model.LinearRegression()
y=datas['BMI'].values
x=datas['gender'].values
x=x.reshape(-1,1)
model.fit(x,y)
print("回归方程系数{}".format(model.coef_))
print("回归方程截距:{}".format(model.intercept_))

#体重(正相关)
from sklearn import  linear_model
model = linear_model.LinearRegression()
y=datas['BMI'].values
x=datas['weight'].values
x=x.reshape(-1,1)
model.fit(x,y)
print("回归方程系数{}".format(model.coef_))
print("回归方程截距:{}".format(model.intercept_))
#胆固醇(正相关)
from sklearn import  linear_model
model = linear_model.LinearRegression()
y=datas['BMI'].values
x=datas['cholesterol'].values
x=x.reshape(-1,1)
model.fit(x,y)
print("回归方程系数{}".format(model.coef_))
print("回归方程截距:{}".format(model.intercept_))

#葡萄糖(正相关)
from sklearn import  linear_model
model = linear_model.LinearRegression()
y=datas['BMI'].values
x=datas['gluc'].values
x=x.reshape(-1,1)
model.fit(x,y)
print("回归方程系数{}".format(model.coef_))
print("回归方程截距:{}".format(model.intercept_))

#抽烟(负相关)
from sklearn import  linear_model
model = linear_model.LinearRegression()
y=datas['BMI'].values
x=datas['smoke'].values
x=x.reshape(-1,1)
model.fit(x,y)
print("回归方程系数{}".format(model.coef_))
print("回归方程截距:{}".format(model.intercept_))

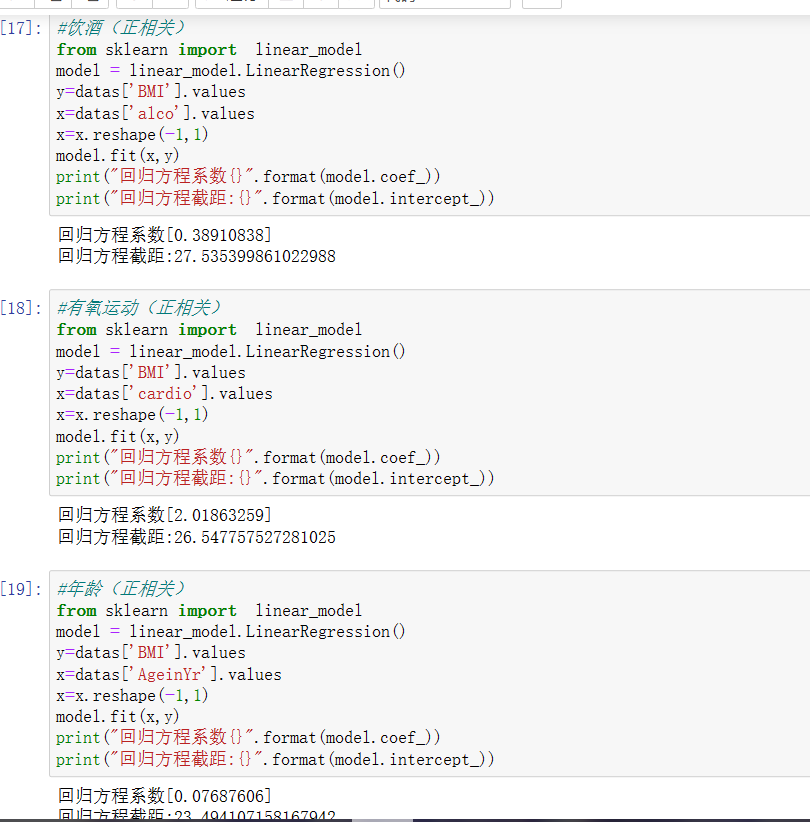
#饮酒(正相关)
from sklearn import  linear_model
model = linear_model.LinearRegression()
y=datas['BMI'].values
x=datas['alco'].values
x=x.reshape(-1,1)
model.fit(x,y)
print("回归方程系数{}".format(model.coef_))
print("回归方程截距:{}".format(model.intercept_))

#有氧运动(正相关)
from sklearn import  linear_model
model = linear_model.LinearRegression()
y=datas['BMI'].values
x=datas['cardio'].values
x=x.reshape(-1,1)
model.fit(x,y)
print("回归方程系数{}".format(model.coef_))
print("回归方程截距:{}".format(model.intercept_))

#年龄(正相关)
from sklearn import  linear_model
model = linear_model.LinearRegression()
y=datas['BMI'].values
x=datas['AgeinYr'].values
x=x.reshape(-1,1)
model.fit(x,y)
print("回归方程系数{}".format(model.coef_))
print("回归方程截距:{}".format(model.intercept_))
#血压高(正相关)
from sklearn import  linear_model
model = linear_model.LinearRegression()
y=datas['BMI'].values
x=datas['ap_hi'].values
x=x.reshape(-1,1)
model.fit(x,y)
print("回归方程系数{}".format(model.coef_))
print("回归方程截距:{}".format(model.intercept_))

#血压低(正相关)
from sklearn import  linear_model
model = linear_model.LinearRegression()
y=datas['BMI'].values
x=datas['ap_lo'].values
x=x.reshape(-1,1)
model.fit(x,y)
print("回归方程系数{}".format(model.coef_))
print("回归方程截距:{}".format(model.intercept_))

#积极地(负相关)
from sklearn import  linear_model
model = linear_model.LinearRegression()
y=datas['BMI'].values
x=datas['active'].values
x=x.reshape(-1,1)
model.fit(x,y)
print("回归方程系数{}".format(model.coef_))
print("回归方程截距:{}".format(model.intercept_))
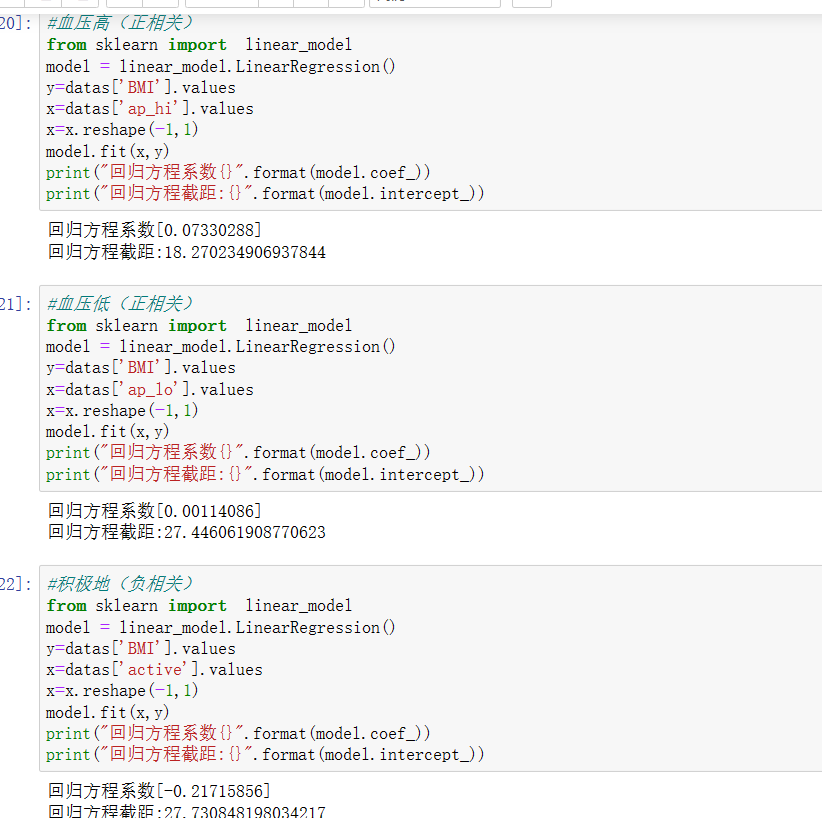
从上面的几组数据的回归方程系数可以了解到与BMI有关的分别有:体重、胆固醇、葡萄糖、饮酒、有氧运动、年龄、血压高和低。下面继续对这几个数据进一步分析。
9、我将其分为四组进行分析
首先是第一组
#绘制图像分析(第一组)
import matplotlib.pyplot as plt
can=plt.figure(figsize=(9,7),edgecolor='red',frameon=True)
#体重与指标
axes1=can.add_subplot(221)
x=datas['weight']
y=datas['BMI']
plt.scatter(x,y)
plt.axis((50,250,0,50))
plt.xlabel('weight')
plt.ylabel('BMI')
plt.title('BMI--weight',fontsize='large',color='blue',fontweight='bold')

#血压高值与指标
axes2=can.add_subplot(222)
x=datas['ap_hi']
y=datas['BMI']
plt.scatter(x,y)
plt.axis((-150,200,0,50))
plt.xlabel('ap_hi')
plt.ylabel('BMI')
plt.title('BMI--ap_hi',fontsize='large',color='red',fontweight='bold')

#血压低值与指标
axes3=can.add_subplot(223)
x=datas['ap_lo']
y=datas['BMI']
plt.scatter(x,y)
plt.axis((-100,100,0,50))
plt.xlabel('ap_lo')
plt.ylabel('BMI')
plt.title('BMI--ap_lo',fontsize='large',color='green',fontweight='bold')

#胆固醇与指标
axes4=can.add_subplot(224)
x=datas['cholesterol']
y=datas['BMI']
plt.scatter(x,y)
plt.axis((0,5,0,50))
plt.xlabel('cholesterol')
plt.ylabel('BMI')
plt.title('BMI--cholesterol',fontsize='large',color='black',fontweight='bold')


can.tight_layout(h_pad=2)
plt.show()
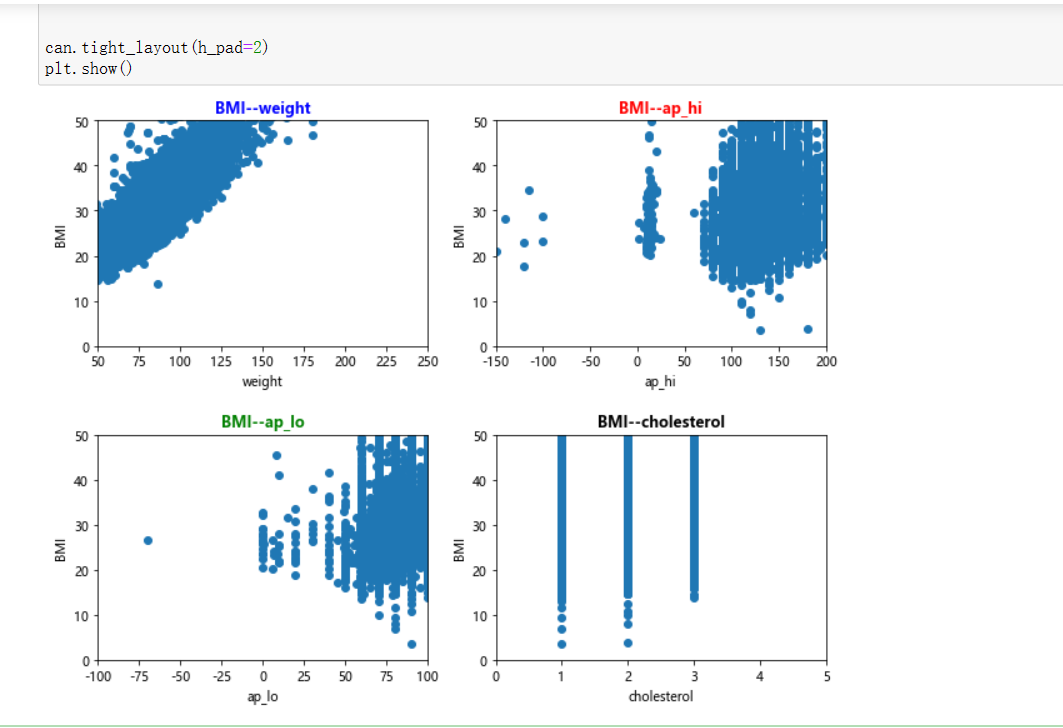
从上面这张图可以看出与BMI有关连的是weight,也就是体重,列入有影响的范畴中,两个血压的效果并没有那么明显,所以结论有带保留,列入可能会影响的范畴里,胆固醇这里就列入无影响范畴里。
下面是第二组
#绘制图像分析(第二组)
import matplotlib.pyplot as plt
can=plt.figure(figsize=(9,7),edgecolor='red',frameon=True)
#葡萄糖与指标
axes1=can.add_subplot(2,2,1)
x=datas['gluc']
y=datas['BMI']
plt.scatter(x,y)
plt.axis((0,5,0,50))
plt.xlabel('gluc')
plt.ylabel('BMI')
plt.title('BMI--gluc',fontsize='large',color='blue',fontweight='bold')

#饮酒与指标
axes2=can.add_subplot(2,2,2)
x=datas['alco']
y=datas['BMI']
plt.scatter(x,y)
plt.axis((0,2,0,50))
plt.xlabel('alco')
plt.ylabel('BMI')
plt.title('BMI--alco',fontsize='large',color='red',fontweight='bold')

#有氧运动与指标
axes3=can.add_subplot(2,2,3)
x=datas['cardio']
y=datas['BMI']
plt.scatter(x,y)
plt.axis((0,2,0,50))
plt.xlabel('cardio')
plt.ylabel('BMI')
plt.title('BMI--cardio',fontsize='large',color='green',fontweight='bold')

#年龄与指标
axes4=can.add_subplot(2,2,4)
x=datas['AgeinYr']
y=datas['BMI']
plt.scatter(x,y)
plt.axis((25,70,0,50))
plt.xlabel('AgeinYr')
plt.ylabel('BMI')
plt.title('BMI--AgeinYr',fontsize='large',color='black',fontweight='bold')

can.tight_layout(h_pad=2)
plt.show()


can.tight_layout(h_pad=2)
plt.show()
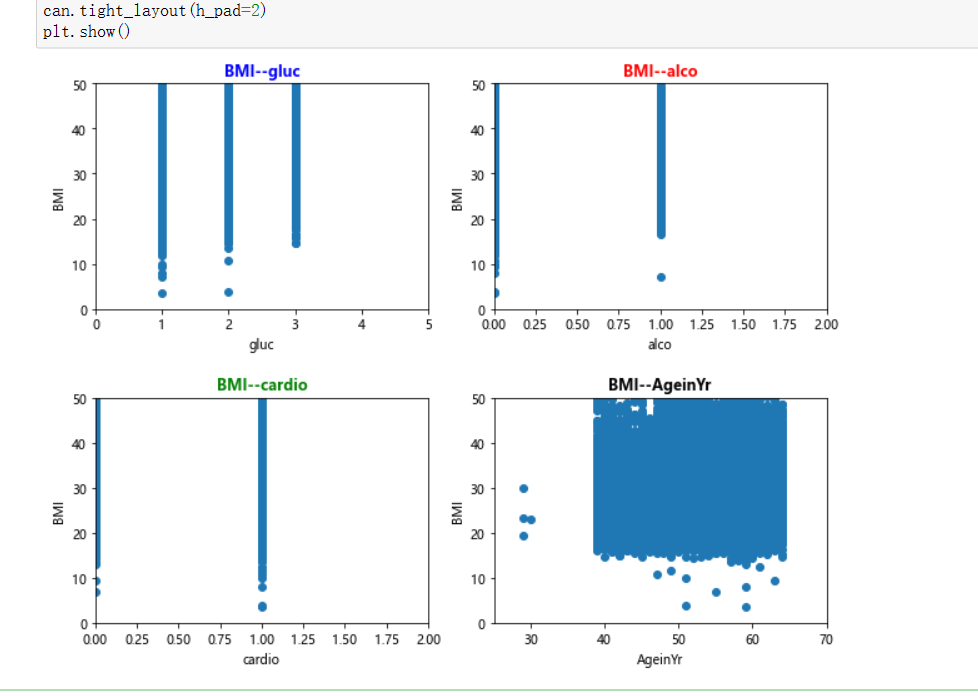
这张就较为明显了,无影响范畴有饮酒、葡萄糖、有氧运动,这里指的是与BMI的对比效果,不一定能说明在其他地方没有影响,列入可能会影响的范畴里。
第三组
#绘制图像分析(第三组)
import matplotlib.pyplot as plt
can=plt.figure(figsize=(9,7),edgecolor='red',frameon=True)
#葡萄糖与有氧运动
axes1=can.add_subplot(221)
x=datas['gluc']
y=datas['cardio']
plt.scatter(x,y)
plt.axis((0,5,0,2))
plt.xlabel('gluc')
plt.ylabel('cardio')
plt.title('cardio--gluc',fontsize='large',color='blue',fontweight='bold')

#胆固醇与有氧运动
axes2=can.add_subplot(222)
x=datas['cholesterol']
y=datas['cardio']
plt.scatter(x,y)
plt.axis((0,5,0,2))
plt.xlabel('cholesterol')
plt.ylabel('cardio')
plt.title('cardio--cholesterol',fontsize='large',color='red',fontweight='bold')

#体重指标与有氧运动
axes3=can.add_subplot(223)
x=datas['BMI']
y=datas['cardio']
plt.scatter(x,y)
plt.axis((3,80,0,2))
plt.xlabel('BMI')
plt.ylabel('cardio')
plt.title('cardio--BMI',fontsize='large',color='green',fontweight='bold')

#胆固醇与葡萄糖
axes4=can.add_subplot(224)
x=datas['cholesterol']
y=datas['gluc']
plt.scatter(x,y)
plt.axis((0,5,0,5))
plt.xlabel('cholesterol')
plt.ylabel('gluc')
plt.title('gluc--cholesterol',fontsize='large',color='black',fontweight='bold')


can.tight_layout(h_pad=2)
plt.show()
这一组是对上一组进一步的探究
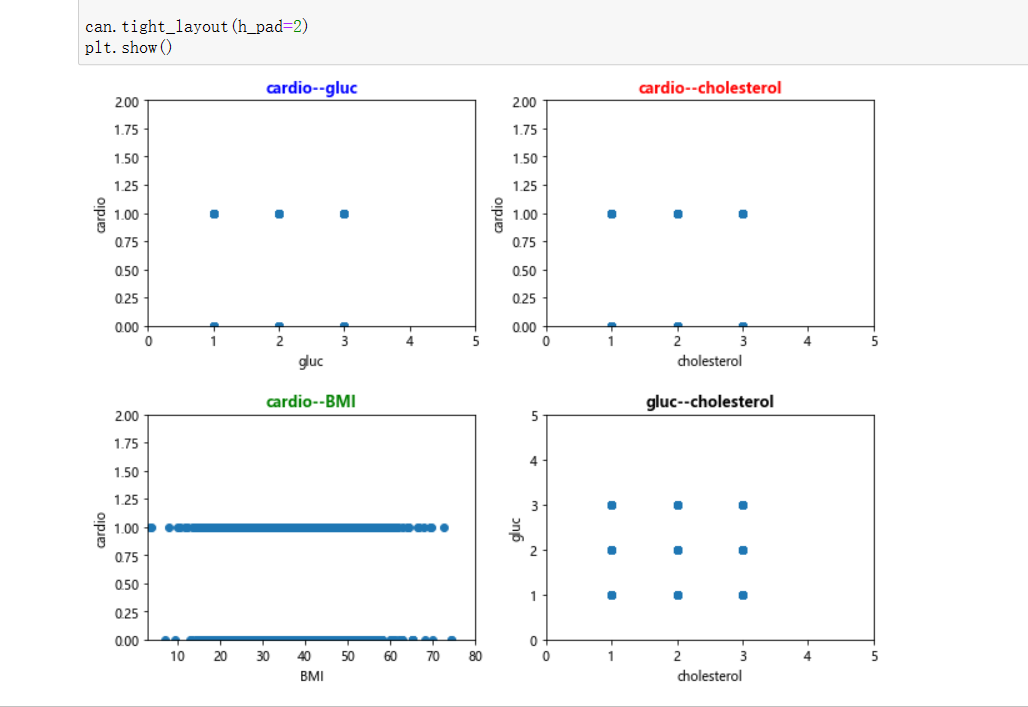
可以看出两两之间没有啥影响,波动基本水平。
最后一组
#绘制图像分析(第四组)
import matplotlib.pyplot as plt
can=plt.figure(figsize=(9,7),edgecolor='red',frameon=True)
#身高与指标
axes1=can.add_subplot(221)
x=datas['height']
y=datas['BMI']
plt.scatter(x,y)
plt.axis((70,200,0,50))
plt.xlabel('height')
plt.ylabel('BMI')
plt.title('BMI--height',fontsize='large',color='blue',fontweight='bold')

#性别与指标
axes2=can.add_subplot(222)
x=datas['gender']
y=datas['BMI']
plt.scatter(x,y)
plt.axis((0,3,0,50))
plt.xlabel('gender')
plt.ylabel('BMI')
plt.title('BMI--gender',fontsize='large',color='red',fontweight='bold')

can.tight_layout(h_pad=2)
plt.show()
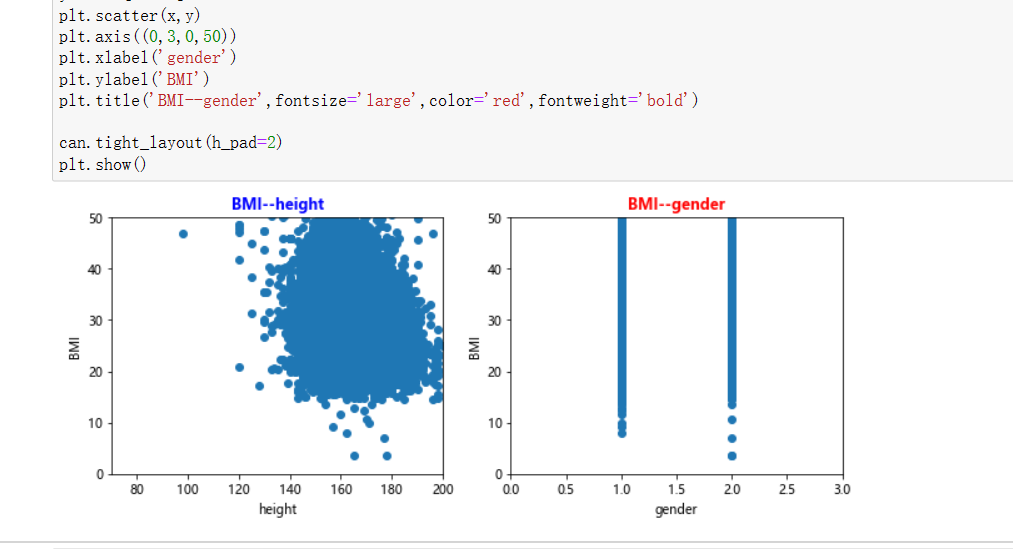
这一张可以看出,前面在计算回归方程系数时表现的负相关的身高在这里也有了一定的波动。
结论:通过上面的几组数据的分析,可以了解到有些影响因素虽然是负相关,但也有其价值,从BMI=weight(kg)/(height(m)*height(m))这个公式中可以了解到BMI是由体重和身高得到的,这里只是从理论上出发,具体情况还需与实际相结合,通过实践去一一了解整体情况,切莫以偏概全。
三、总结
现在大多数人都在追求一个好的身材,所以他们自然无法忍受肥胖的身材。BMI被世界公认为评估肥胖程度的分级方法。世界卫生组织也以BMI定义肥胖或超重。BMI过高有什么危害?bmi增高与哪些因素有关?BMI过高有什么危害?
bmi指数的增加不仅会导致超重和肥胖,还会增加冠心病和中风的发病率。超重和肥胖是冠心病和中风的独立危险因素。体重指数每增加2,冠心病、中风、缺血性中风的相对风险分别增加15.4%、6.1%和18.8%。一旦体重指数达到或超过24点,患高血压、糖尿病、冠心病和血脂异常等严重危害健康的可能性将显著增加。bmi增高与这6点因素有关:
1、偏食
比如喜欢甜食、肥肉、猪内脏、奶油、巧克力、油炸食品,喜欢肯德基、麦当劳等外国快餐,导致营养供应不均衡。
2、吃得太快
吃得快的人比嚼得慢的人更容易发胖。吃东西时,血糖会升高,并向饱满的中心发出信号,让我们感到饱腹感。一般来说,信号传输大约需要20分钟。然而,如果你吃得快,你会在收到饱腹感信号之前吃得更多。如果你慢慢咀嚼,你可以在吃得更快时感到饱腹感,而不是吃得更少。
3、不吃饭
不吃东西会影响你的身体控制食欲的能力。它会崩溃你的意志力。自我调节是大脑的一种活动。你的大脑需要葡萄糖来提供能量。如果你不吃早餐或健康的间食,如果你的大脑没有能量支持,它将不可避免地向你报复,并在下一餐中吃得更多。
4、太爱吃肉
因为大多数喜欢肉的人都不喜欢蔬菜。但这种饮食习惯会让你缺乏很多营养,比如维生素和纤维素。缺乏这些东西,很容易导致身体代谢不稳定,导致肥胖。
5、缺乏睡眠
研究发现,每晚睡眠等于或少于5小时的人的腹部脂肪增加约为睡眠6-7小时的2.5倍,睡眠不足也会导致新陈代谢下降。
6、缺乏运动
很多人肥胖的原因是bmi指数过高,因为平时缺乏运动,导致身体脂肪无法消耗。
通过上面网上了解到的可以看出,影响BMI的因素太过之多,比如偏食的情况下会导致体内的胆固醇、脂肪、葡萄糖等都发生变化,从而影响自身BMI指标,上面的分析知识通过体重和身高进行解读,实际情况下还应考虑其他各个方面的因素,比如生活习惯、饮食作息等。
下面是对自己的一些总结:
优点:
1、通过本次课题的研究,了解到了医疗上的一些知识,并且获取一定的知识,扩宽自己的见识面。
2、通过对数据集的分析可以了解和学习python的强大,对后面的学习有一定的帮助。
3、对生活方面的一些注意事项有所了解,通过对数据的分析了解事物背后的真相,了解事物发展的客观规律,利于科学决策,改变过去的经验思维,帮助人们建立数据思维。
不足:
1、对代码的了解程度不够深,实际应用过程中容易出现卡顿,遇到错误没有及时的作出反馈,以调整进程。
2、对该数据的分析结果只有在数据质量良好的情况下才能产生良好的效果。然而,该数据可能受到多种因素的影响,包括数据来源、数据格式、数据完整性、数据精度等等。
3、数据分析可能会导致误导性的结论。如果数据不够准确或数据分析不合理,就会得出错误的结论。这些错误的结论可能会导致实际情况下做出错误的决策,从而对结果造成不利影响。
最后,附上全部源代码
#一、导入数据集
import pandas as pd
from datetime import datetime
data=pd.DataFrame(pd.read_csv(r'健康检查.csv'))
data

#二、重复值处理
data_df=data.drop_duplicates()
data_df.head()

#三、清除空值
datas = data_df.dropna()
display(datas)

#四、查看是否有NAN值
data.isna().any()

#五、删除无效列(id对分析结果没有影响)
datas.drop('id',axis=1,inplace=True)
datas.drop('Unnamed: 0',axis=1,inplace=True)
datas

#七、查看每栏的统计
datas.describe()

#八、异常值处理
datas.replace([298.700000],datas['BMI'].mean())
datas.replace([11000.000000],datas['ap_lo'].mean())

#增加一列名为Health_indicators的列,为后面数据分析做准备
def getlevel(BMI):
    if(BMI<18.5):
        return 1
    elif(18.5<=BMI<=24.9):
        return 2
    elif(25<=BMI<=29.9):
        return 3
    elif(30<=BMI<=34.9):
        return 4
    elif(35<=BMI<=39.9):
        return 5
    elif(40<=BMI):
        return 6

#Low weight(低体重):1
#Normal weight(正常体重):2
#over weight(超重):3
#level 1 obesity(I级肥胖):4
#level 2 obesity(II级肥胖):5
#level 3 obesity(III级肥胖):6
data['Health_indicators'] = data.apply(lambda x: getlevel(x.BMI), axis=1)

data

#统计一下该列各个数据个数
a=list(data['Health_indicators']).count(1)
b=list(data['Health_indicators']).count(2)
c=list(data['Health_indicators']).count(3)
d=list(data['Health_indicators']).count(4)
e=list(data['Health_indicators']).count(5)
f=list(data['Health_indicators']).count(6)
print("低体重个数为:",a)
print("正常体重个数为:",b)
print("超重个数为:",c)
print("I级肥胖个数为:",d)
print("II级肥胖个数为:",e)
print("III级肥胖个数为:",f)

#对该列进行数据科学化

import matplotlib.pyplot as plt

plt.rcParams['font.sans-serif']=['Microsoft YaHei']  #显示中文标签,处理中文乱码问题
plt.rcParams['axes.unicode_minus']=False  #坐标轴负号的处理
plt.axes(aspect='equal')  #将横、纵坐标轴标准化处理,确保饼图是一个正圆,否则为椭圆

edu = [a,b,c,d,e,f]
labels = ['低体重','正常体重','超重','I级肥胖','II级肥胖','III级肥胖']
colors = ['#9999ff', '#ff9999', '#7777aa', '#2442aa', '#dd5555','#FFFF00']

plt.pie(x=edu,  #绘图数据
        labels=labels,  #添加教育水平标签
        colors=colors,
        autopct='%.2f%%',  #百分比的格式
        pctdistance=0.8,  #百分比标签与圆心的距离
        labeldistance=1.1,  #教育水平标签与圆心的距离
        startangle=180,  #饼图的初始角度
        radius=1.2,  #饼图的半径
        counterclock=False,  #是否逆时针,这里设置为顺时针方向
        wedgeprops={'linewidth':1.5, 'edgecolor':'green'},  #饼图内外边界的属性值
        textprops={'fontsize':10, 'color':'black'},  #文本标签的属性值
        )

#添加图标题
plt.title('健康指标直观图')
#显示图形
plt.show()

#求各列与BMI列的回归方程系数
#身高(负相关)
from sklearn import  linear_model
model = linear_model.LinearRegression()
y=datas['BMI'].values
x=datas['height'].values
x=x.reshape(-1,1)
model.fit(x,y)
print("回归方程系数{}".format(model.coef_))
print("回归方程截距:{}".format(model.intercept_))

#性别(负相关)
from sklearn import  linear_model
model = linear_model.LinearRegression()
y=datas['BMI'].values
x=datas['gender'].values
x=x.reshape(-1,1)
model.fit(x,y)
print("回归方程系数{}".format(model.coef_))
print("回归方程截距:{}".format(model.intercept_))

#体重(正相关)
from sklearn import  linear_model
model = linear_model.LinearRegression()
y=datas['BMI'].values
x=datas['weight'].values
x=x.reshape(-1,1)
model.fit(x,y)
print("回归方程系数{}".format(model.coef_))
print("回归方程截距:{}".format(model.intercept_))

#胆固醇(正相关)
from sklearn import  linear_model
model = linear_model.LinearRegression()
y=datas['BMI'].values
x=datas['cholesterol'].values
x=x.reshape(-1,1)
model.fit(x,y)
print("回归方程系数{}".format(model.coef_))
print("回归方程截距:{}".format(model.intercept_))

#葡萄糖(正相关)
from sklearn import  linear_model
model = linear_model.LinearRegression()
y=datas['BMI'].values
x=datas['gluc'].values
x=x.reshape(-1,1)
model.fit(x,y)
print("回归方程系数{}".format(model.coef_))
print("回归方程截距:{}".format(model.intercept_))

#抽烟(负相关)
from sklearn import  linear_model
model = linear_model.LinearRegression()
y=datas['BMI'].values
x=datas['smoke'].values
x=x.reshape(-1,1)
model.fit(x,y)
print("回归方程系数{}".format(model.coef_))
print("回归方程截距:{}".format(model.intercept_))

#饮酒(正相关)
from sklearn import  linear_model
model = linear_model.LinearRegression()
y=datas['BMI'].values
x=datas['alco'].values
x=x.reshape(-1,1)
model.fit(x,y)
print("回归方程系数{}".format(model.coef_))
print("回归方程截距:{}".format(model.intercept_))

#有氧运动(正相关)
from sklearn import  linear_model
model = linear_model.LinearRegression()
y=datas['BMI'].values
x=datas['cardio'].values
x=x.reshape(-1,1)
model.fit(x,y)
print("回归方程系数{}".format(model.coef_))
print("回归方程截距:{}".format(model.intercept_))

#年龄(正相关)
from sklearn import  linear_model
model = linear_model.LinearRegression()
y=datas['BMI'].values
x=datas['AgeinYr'].values
x=x.reshape(-1,1)
model.fit(x,y)
print("回归方程系数{}".format(model.coef_))
print("回归方程截距:{}".format(model.intercept_))

#血压高(正相关)
from sklearn import  linear_model
model = linear_model.LinearRegression()
y=datas['BMI'].values
x=datas['ap_hi'].values
x=x.reshape(-1,1)
model.fit(x,y)
print("回归方程系数{}".format(model.coef_))
print("回归方程截距:{}".format(model.intercept_))

#血压低(正相关)
from sklearn import  linear_model
model = linear_model.LinearRegression()
y=datas['BMI'].values
x=datas['ap_lo'].values
x=x.reshape(-1,1)
model.fit(x,y)
print("回归方程系数{}".format(model.coef_))
print("回归方程截距:{}".format(model.intercept_))

#积极地(负相关)
from sklearn import  linear_model
model = linear_model.LinearRegression()
y=datas['BMI'].values
x=datas['active'].values
x=x.reshape(-1,1)
model.fit(x,y)
print("回归方程系数{}".format(model.coef_))
print("回归方程截距:{}".format(model.intercept_))

#分析
#绘制图像分析(第一组)
import matplotlib.pyplot as plt
can=plt.figure(figsize=(9,7),edgecolor='red',frameon=True)
#体重与指标
axes1=can.add_subplot(221)
x=datas['weight']
y=datas['BMI']
plt.scatter(x,y)
plt.axis((50,250,0,50))
plt.xlabel('weight')
plt.ylabel('BMI')
plt.title('BMI--weight',fontsize='large',color='blue',fontweight='bold')

#血压高值与指标
axes2=can.add_subplot(222)
x=datas['ap_hi']
y=datas['BMI']
plt.scatter(x,y)
plt.axis((-150,200,0,50))
plt.xlabel('ap_hi')
plt.ylabel('BMI')
plt.title('BMI--ap_hi',fontsize='large',color='red',fontweight='bold')

#血压低值与指标
axes3=can.add_subplot(223)
x=datas['ap_lo']
y=datas['BMI']
plt.scatter(x,y)
plt.axis((-100,100,0,50))
plt.xlabel('ap_lo')
plt.ylabel('BMI')
plt.title('BMI--ap_lo',fontsize='large',color='green',fontweight='bold')

#胆固醇与指标
axes4=can.add_subplot(224)
x=datas['cholesterol']
y=datas['BMI']
plt.scatter(x,y)
plt.axis((0,5,0,50))
plt.xlabel('cholesterol')
plt.ylabel('BMI')
plt.title('BMI--cholesterol',fontsize='large',color='black',fontweight='bold')


can.tight_layout(h_pad=2)
plt.show()

#绘制图像分析(第二组)
import matplotlib.pyplot as plt
can=plt.figure(figsize=(9,7),edgecolor='red',frameon=True)
#葡萄糖与指标
axes1=can.add_subplot(2,2,1)
x=datas['gluc']
y=datas['BMI']
plt.scatter(x,y)
plt.axis((0,5,0,50))
plt.xlabel('gluc')
plt.ylabel('BMI')
plt.title('BMI--gluc',fontsize='large',color='blue',fontweight='bold')

#饮酒与指标
axes2=can.add_subplot(2,2,2)
x=datas['alco']
y=datas['BMI']
plt.scatter(x,y)
plt.axis((0,2,0,50))
plt.xlabel('alco')
plt.ylabel('BMI')
plt.title('BMI--alco',fontsize='large',color='red',fontweight='bold')

#有氧运动与指标
axes3=can.add_subplot(2,2,3)
x=datas['cardio']
y=datas['BMI']
plt.scatter(x,y)
plt.axis((0,2,0,50))
plt.xlabel('cardio')
plt.ylabel('BMI')
plt.title('BMI--cardio',fontsize='large',color='green',fontweight='bold')

#年龄与指标
axes4=can.add_subplot(2,2,4)
x=datas['AgeinYr']
y=datas['BMI']
plt.scatter(x,y)
plt.axis((25,70,0,50))
plt.xlabel('AgeinYr')
plt.ylabel('BMI')
plt.title('BMI--AgeinYr',fontsize='large',color='black',fontweight='bold')


can.tight_layout(h_pad=2)
plt.show()

#绘制图像分析(第三组)
import matplotlib.pyplot as plt
can=plt.figure(figsize=(9,7),edgecolor='red',frameon=True)
#葡萄糖与有氧运动
axes1=can.add_subplot(221)
x=datas['gluc']
y=datas['cardio']
plt.scatter(x,y)
plt.axis((0,5,0,2))
plt.xlabel('gluc')
plt.ylabel('cardio')
plt.title('cardio--gluc',fontsize='large',color='blue',fontweight='bold')

#胆固醇与有氧运动
axes2=can.add_subplot(222)
x=datas['cholesterol']
y=datas['cardio']
plt.scatter(x,y)
plt.axis((0,5,0,2))
plt.xlabel('cholesterol')
plt.ylabel('cardio')
plt.title('cardio--cholesterol',fontsize='large',color='red',fontweight='bold')

#体重指标与有氧运动
axes3=can.add_subplot(223)
x=datas['BMI']
y=datas['cardio']
plt.scatter(x,y)
plt.axis((3,80,0,2))
plt.xlabel('BMI')
plt.ylabel('cardio')
plt.title('cardio--BMI',fontsize='large',color='green',fontweight='bold')

#胆固醇与葡萄糖
axes4=can.add_subplot(224)
x=datas['cholesterol']
y=datas['gluc']
plt.scatter(x,y)
plt.axis((0,5,0,5))
plt.xlabel('cholesterol')
plt.ylabel('gluc')
plt.title('gluc--cholesterol',fontsize='large',color='black',fontweight='bold')


can.tight_layout(h_pad=2)
plt.show()

#绘制图像分析(第四组)
import matplotlib.pyplot as plt
can=plt.figure(figsize=(9,7),edgecolor='red',frameon=True)
#身高与指标
axes1=can.add_subplot(221)
x=datas['height']
y=datas['BMI']
plt.scatter(x,y)
plt.axis((70,200,0,50))
plt.xlabel('height')
plt.ylabel('BMI')
plt.title('BMI--height',fontsize='large',color='blue',fontweight='bold')

#性别与指标
axes2=can.add_subplot(222)
x=datas['gender']
y=datas['BMI']
plt.scatter(x,y)
plt.axis((0,3,0,50))
plt.xlabel('gender')
plt.ylabel('BMI')
plt.title('BMI--gender',fontsize='large',color='red',fontweight='bold')

can.tight_layout(h_pad=2)
plt.show()