一、选题背景
近年来,长江存储的技术发展可谓飞速,对市场的影响也是巨大的。 自去年长江存储192层级3D NAND闪存量产,国产存储芯片在技术上已经不输以三星为代表的国际厂商的技术水准,甚至在一些领域实现了超越性发展。 技术的突破带来的是对市场的影响,长江存储正成为改变中国SSD市场格局的最大变量。通过固态硬盘各方面的分析,我们可以直观的看见长江存储对目前固态硬盘市场造成的影响,以及我们在购买该类产品时提供参考价值。
二、网路爬虫设计方案
1.方案名称:爬取中关村在线固态硬盘及可视化
2.主要内容:爬取中关村在线中热门固态硬盘排行及固态硬盘品牌排行
3.主题式网络爬虫设计方案概述(包括实现思路与技术难点)
(1)实现思路:查看HTML结构——查看爬取内容的位置——爬出数据——数据存储——数据处理及分析——数据可视化
(2)技术难点:网站的结构,网站的反爬虫机制,该网站由于品牌的排行榜与固态硬盘排行榜不在一个网站我们将分开进行爬取
三、数据爬取过程及分析步骤
1.网面的结构与特征分析
热门固态硬盘排行的网页

固态硬盘品牌排行的网页
2.Htmls 页面解析
热门固态硬盘排行的Htmls 页面解析

固态硬盘品牌排行的Htmls 页面解析

四、网络爬虫程序设计
1.数据爬取与采集
(1)以下是爬取热门固态硬盘排行的代码
  1 import csv
  2 import os
  3 import requests
  4 from bs4 import BeautifulSoup
  5 import pandas as pd
  6 #用于读取/编写Excel 2010 xlsx/xlsm/xltx/xltm文件的Python库
  7 from openpyxl import Workbook
  8 #与pandas交互使用
  9 from openpyxl.utils.dataframe import dataframe_to_rows
 10
 11 def crawl_function(url, save_path):
 12
 13     headers = {
 14         'User-Agent': 'Mozilla/5.0 (Windows NT 10.0; Win64; x64) AppleWebKit/537.36 (KHTML, like Gecko) '
 15                       'Chrome/112.0.0.0 Safari/537.36 Edg/112.0.1722.64'
 16     }
 17     # 解决requests请求反爬取
 18     response = requests.get(url, headers=headers)
 19
 20     if response.status_code == 200:
 21         # 200代表OK请求成功
 22         soup = BeautifulSoup(response.content, 'html.parser')
 23
 24         section_head = soup.find('div', class_='section__head clearfix')
 25         titles = section_head.find_all('h3')
 26
 27         for title in titles:
 28             print('爬取内容:', title.get_text().strip())
 29
 30         product_names = soup.find_all('div', class_='rank__name')#名称
 31         product_ranks = soup.find_all('div', class_='rank__number')#排名
 32         product_prices = soup.find_all('div', class_='rank__price')#价格
 33         product_ratings = soup.find_all('div', class_='score clearfix')#评分
 34
 35         # 创建DataFrame用于存储数据
 36         data = []
 37         for name, rank, price, rating in zip(product_names, product_ranks, product_prices, product_ratings):
 38             product_name = name.get_text().strip()
 39             # 去掉原本带着的¥符号
 40             product_price = price.get_text().strip().replace('¥', '')
 41
 42             # 处理排名的情况
 43             rank_class = rank.find('i', class_='crown-icon')
 44             if rank_class:
 45                 # 如果排名是皇冠图标,则代表第一名
 46                 product_rank = '1'
 47             else:
 48                 product_rank = rank.get_text().strip()
 49
 50             # 处理评分的情况
 51             rating_element = rating.find('span')
 52             if rating_element:
 53                 rating_value_with_unit = rating_element.get_text().strip()
 54                 # 去掉“分”字只留下数值
 55                 rating_value = rating_value_with_unit.replace('分', '')
 56             else:
 57                 rating_value = '暂无评分'
 58
 59             data.append([product_name, product_price, product_rank, rating_value])
 60
 61         df = pd.DataFrame(data, columns=['产品名称', '价格', '排名', '评分'])
 62
 63         # 创建Excel文件并保存DataFrame
 64         workbook = Workbook()
 65         worksheet = workbook.active
 66         for row in dataframe_to_rows(df, index=False, header=True):
 67             worksheet.append(row)
 68
 69         # 调整产品名称列的宽度
 70         max_width = 0
 71         for cell in worksheet['A']:
 72             if cell.value:
 73                 if len(str(cell.value)) > max_width:
 74                     max_width = len(str(cell.value))
 75         worksheet.column_dimensions['A'].width = max_width
 76
 77         # 获取文件夹路径
 78         folder_path = os.path.dirname(save_path)
 79         # 创建文件夹(如果不存在)
 80         os.makedirs(folder_path, exist_ok=True)
 81
 82         # 检查该文件是否已经存在
 83         if os.path.isfile(save_path):
 84             print(f"文件已存在,已被覆盖: {save_path}")
 85             #用于提示该程序的第2-n次运行
 86
 87         # 保存Excel文件
 88         workbook.save(save_path)
 89
 90         #网页请求成功结果及失败提示
 91         print(f"数据已保存为 {save_path} 文件")
 92     else:
 93         print('请求失败:', response.status_code)
 94
 95 if __name__ == "__main__":
 96     # 爬取网页地址
 97     url = 'https://top.zol.com.cn/compositor/626/cpu.html'
 98     #文件存储地址及命名
 99     save_path = 'D:\\Edge download\\product_data.xlsx'
100     #调用爬取函数
101     crawl_function(url, save_path)
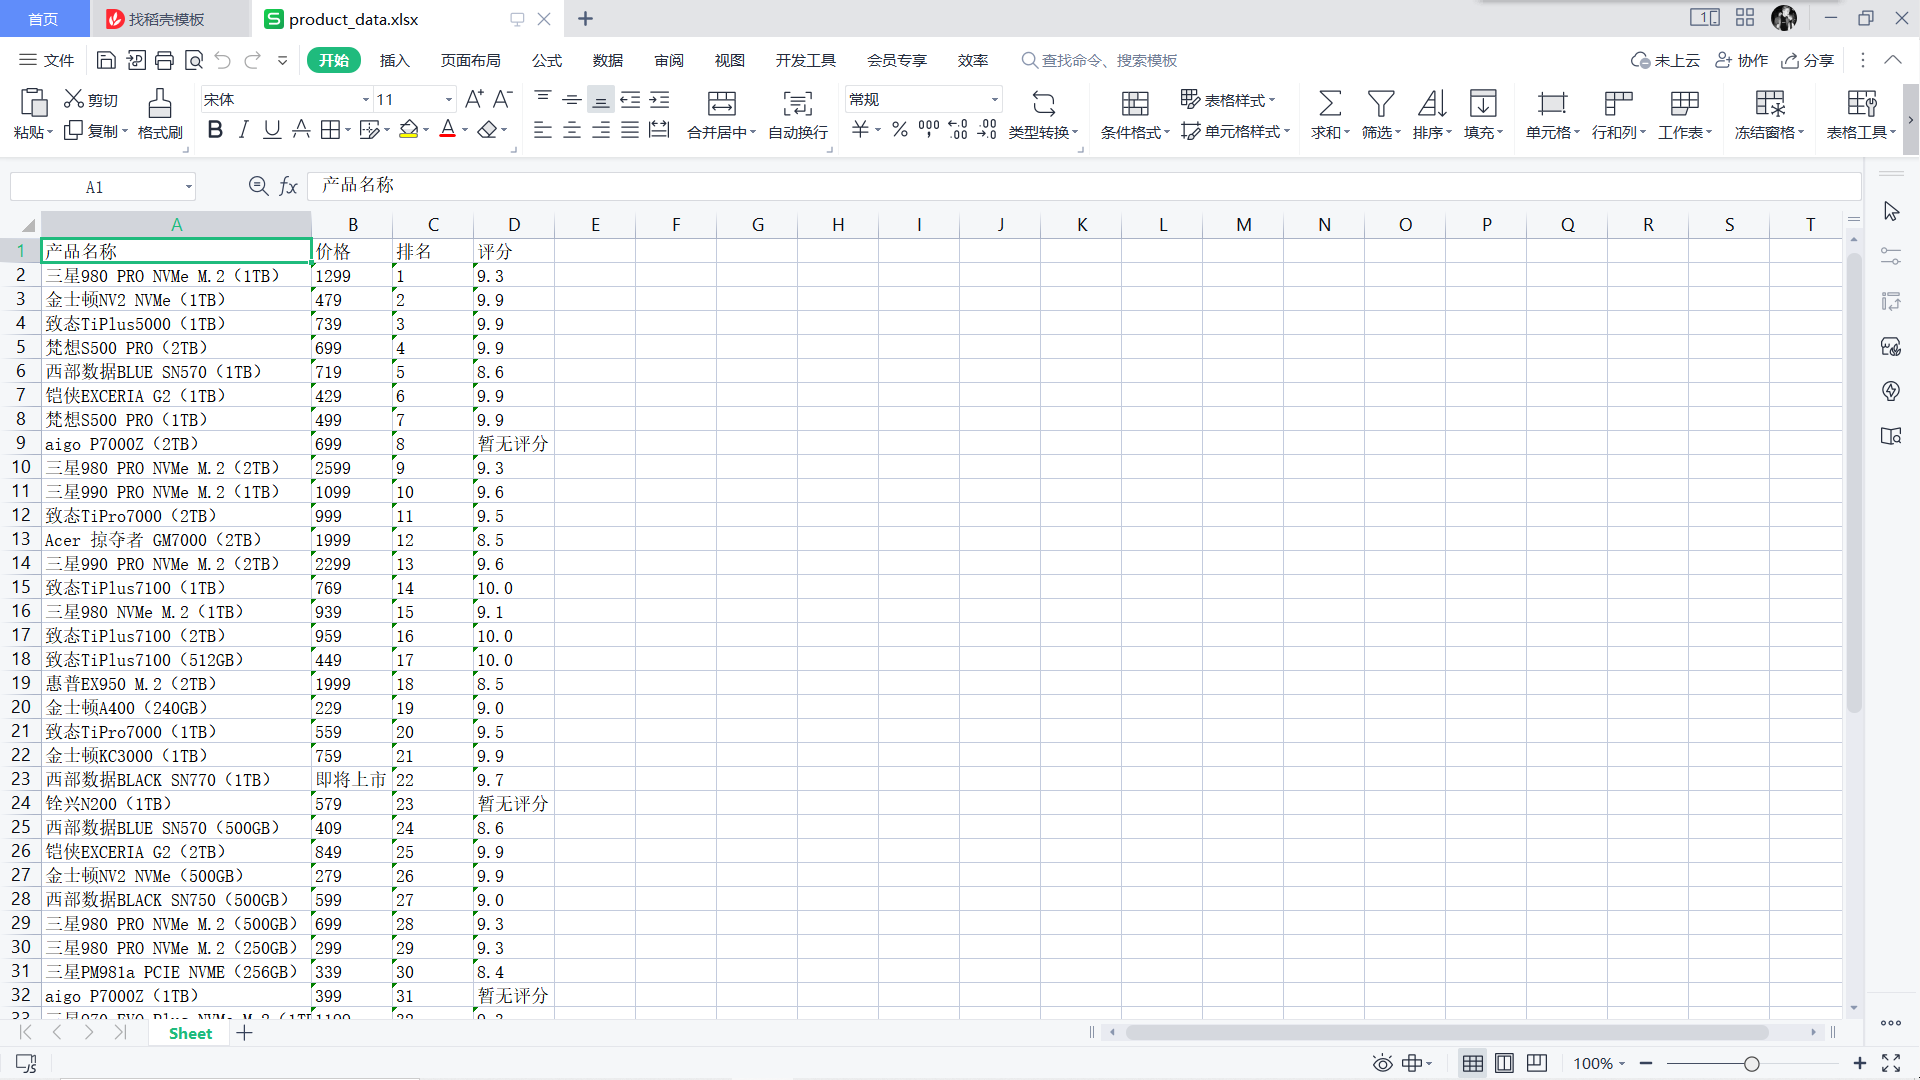
爬取后的信息保存到xlsx文件中,如图所示
(2)以下是固态硬盘品牌排行的代码
 1 import os
 2 import requests
 3 from bs4 import BeautifulSoup
 4 from openpyxl import Workbook
 5
 6 def brand_crawl_function(url, file_path):
 7     response = requests.get(url)
 8
 9     if response.status_code == 200:
10         soup = BeautifulSoup(response.text, 'html.parser')
11         brand_list = soup.find_all('div', class_='rank-list__cell')
12
13         # 创建一个新的Excel文件
14         workbook = Workbook()
15         sheet = workbook.active
16
17         # 写入表头
18         header = ['排名', '品牌', '品牌占有率', '好评率']
19         sheet.append(header)
20
21         for i in range(7, len(brand_list), 7):  # 从索引为7开始,跳过第一行
22             rank = brand_list[i]
23             rank_class = rank.find('i', class_='crown-icon')
24             if rank_class:
25                 product_rank = '1'  # 如果排名是皇冠图标,则代表第一名
26             else:
27                 product_rank = rank.get_text().strip()
28
29             brand_name = brand_list[i+1].text
30             brand_occupancy = brand_list[i+3].text
31             brand_positive_rate = brand_list[i+5].text
32
33             # 写入每个品牌的信息
34             row = [product_rank, brand_name, brand_occupancy, brand_positive_rate]
35             sheet.append(row)
36
37         # 保存Excel文件到指定路径
38         directory = os.path.dirname(file_path)
39         if not os.path.exists(directory):
40             os.makedirs(directory)
41
42         if os.path.isfile(file_path):
43             print(f"文件已存在,已被覆盖: {file_path}")
44
45         workbook.save(file_path)
46         print(f"数据已保存为 {file_path} 文件")
47     else:
48         print('请求失败:', response.status_code)
49
50
51 if __name__ == "__main__":
52     # 调用函数进行爬取并保存到Excel文件
53     url = 'https://top.zol.com.cn/compositor/626/manu_attention.html'
54     file_path = r'D:\Edge download\brands.xlsx'
55     brand_crawl_function(url, file_path)
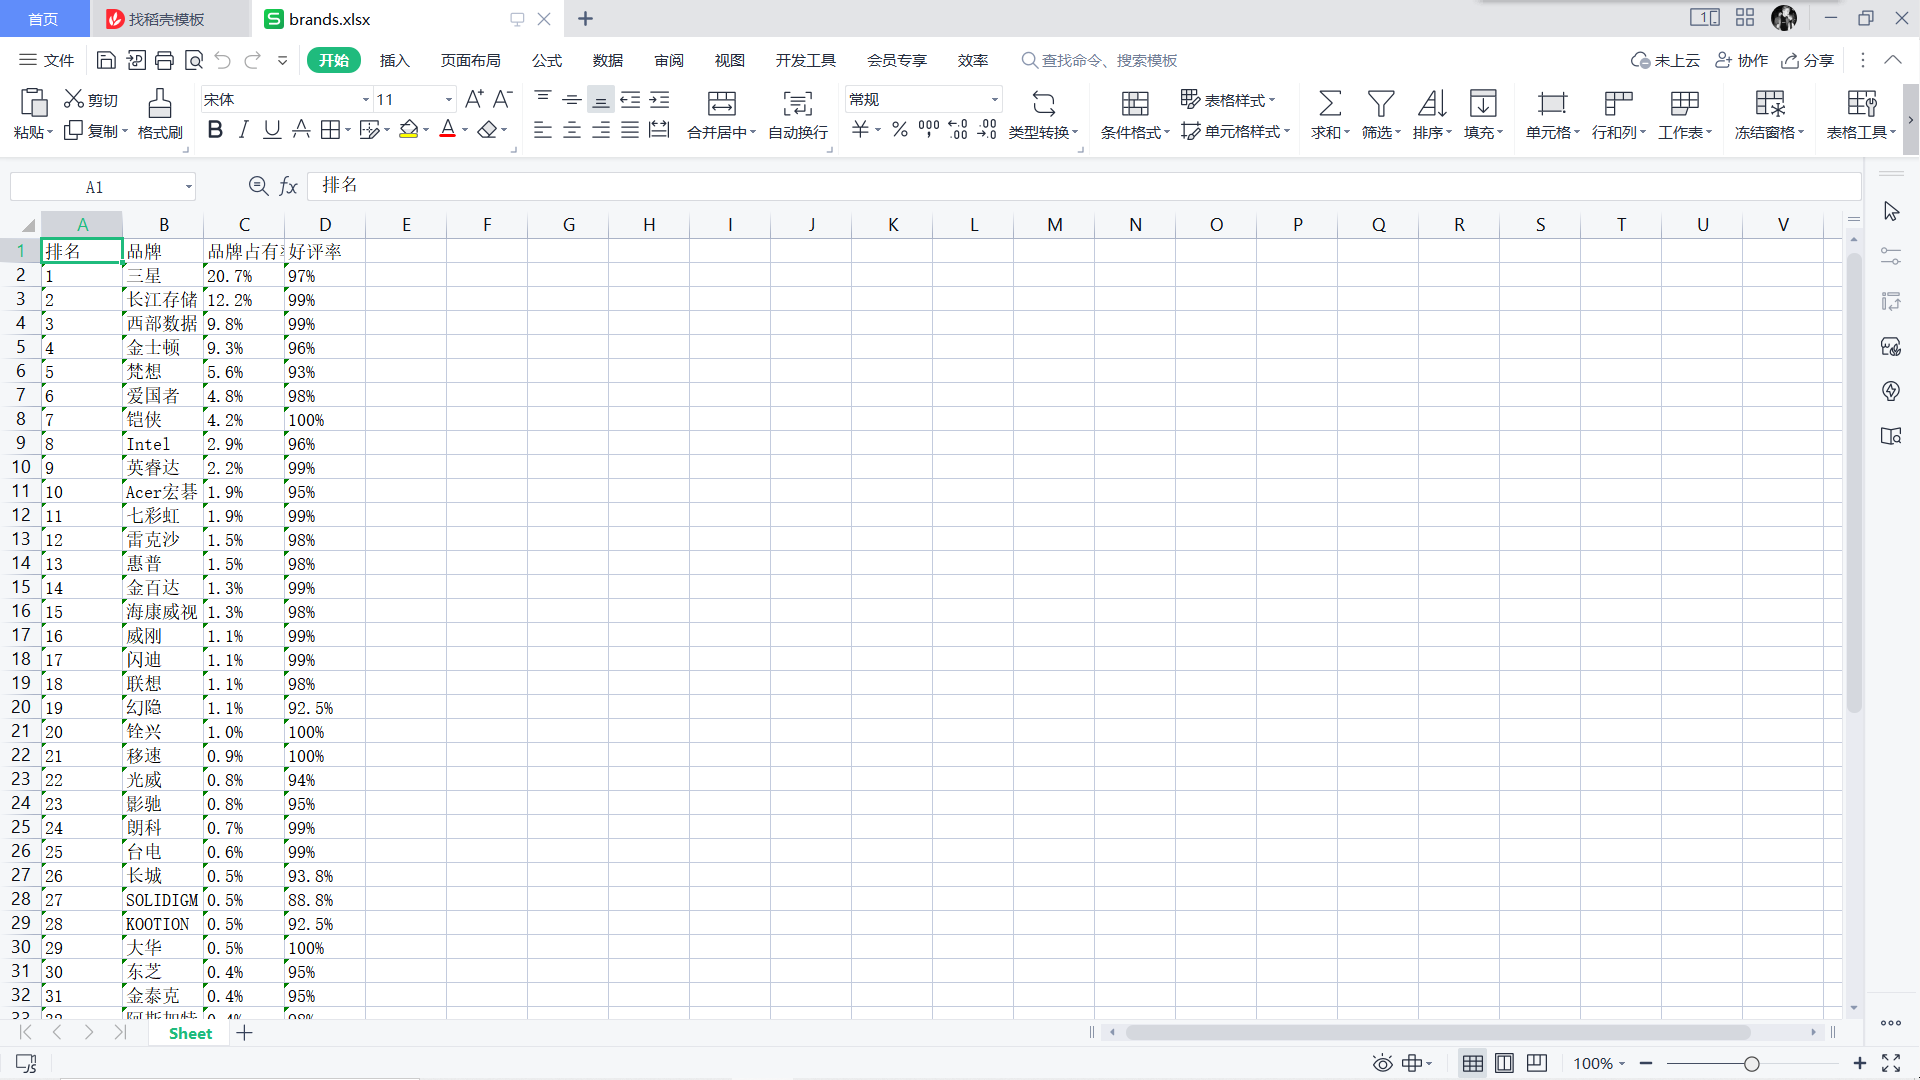
爬取后的信息保存到xlsx文件中,如图所示
2.数据清洗和处理
首先,观察你爬取到的信息在针对性做出处理以便后面可视化的实现。
(1)以下是热门固态硬盘排行的数据清洗和处理的代码
 1 import pandas as pd
 2 from openpyxl import load_workbook
 3
 4 # 读取Excel文件
 5 input_file = 'D:\\Edge download\\product_data.xlsx'
 6 df = pd.read_excel(input_file)
 7
 8 # 删除'价格'列中带有中文字符的产品
 9 df = df[~df['价格'].str.contains('[\u4e00-\u9fff]')]
10
11 # 删除'评分'列中带有中文字符的产品
12 df = df[~df['评分'].str.contains('[\u4e00-\u9fff]')]
13
14 # 将清理后的数据保存到新文件中
15 output_file = 'D:\\Edge download\\cleaned_product_data.xlsx'
16 df.to_excel(output_file, index=False)
17
18 # 调整产品名称列的宽度
19 book = load_workbook(output_file)
20 worksheet = book.active
21 max_width = 0
22 for cell in worksheet['A']:
23     if cell.value:
24         if len(str(cell.value)) > max_width:
25             max_width = len(str(cell.value))
26 worksheet.column_dimensions['A'].width = max_width
27
28 book.save(output_file)
29 book.close()
30
31 print(f"清理后的数据已保存到 {output_file}")
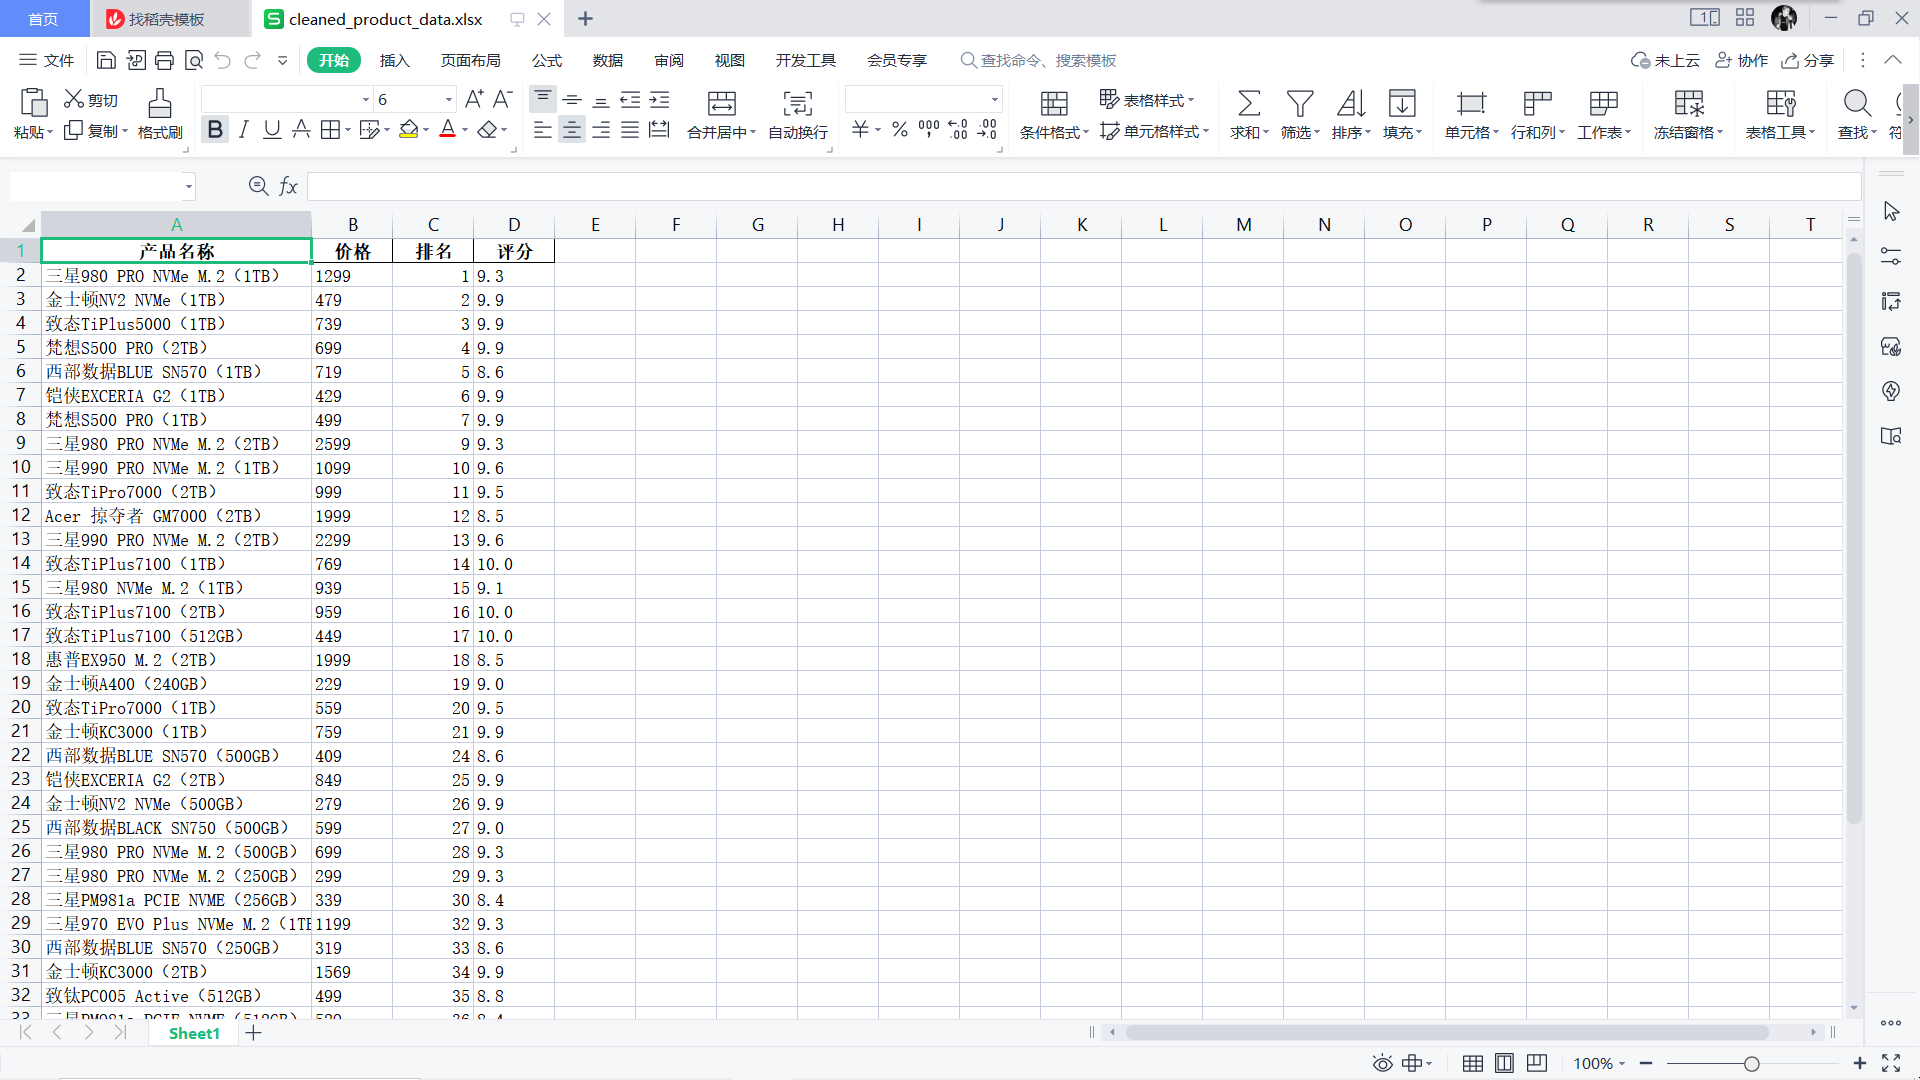
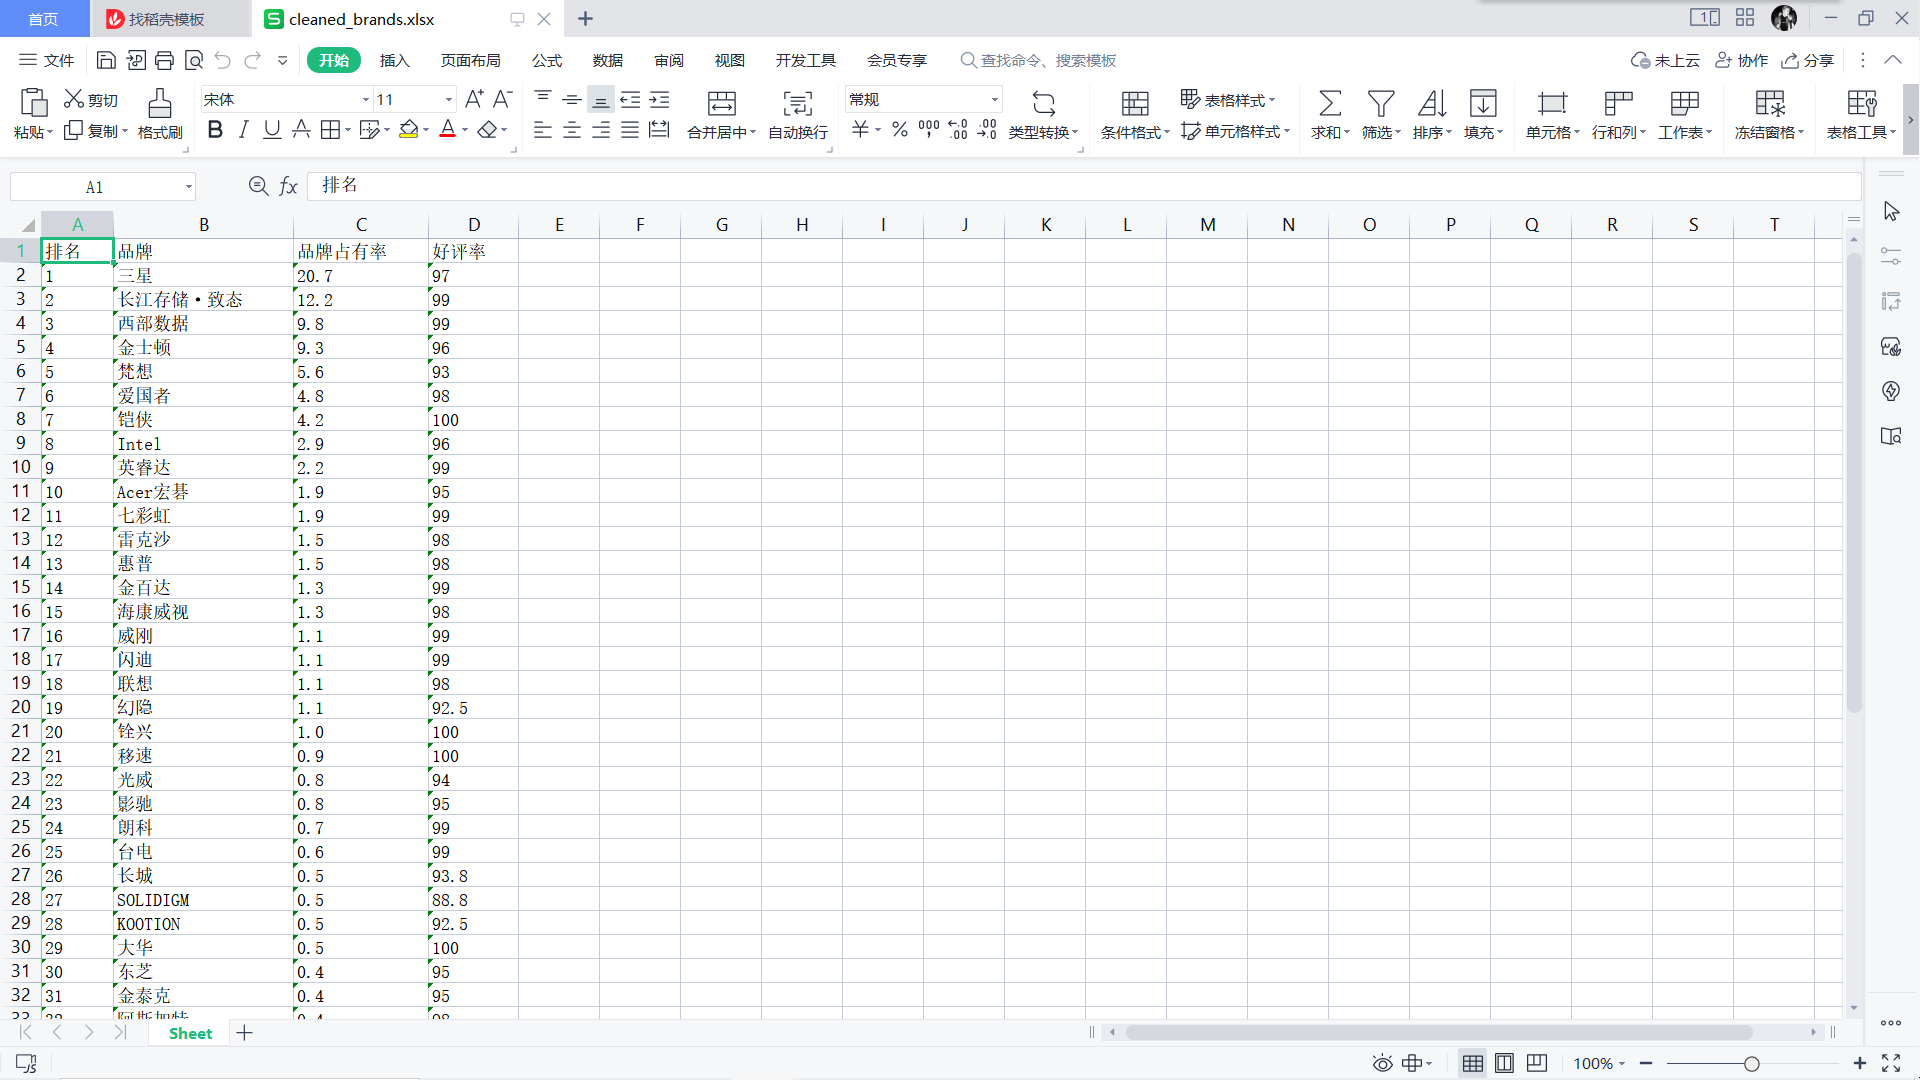
清洗后的数据
(2)以下是固态硬盘品牌排行的数据清洗和处理的代码
 1 import openpyxl
 2
 3 def read_excel_file(file_path):
 4     workbook = openpyxl.load_workbook(file_path)
 5     sheet = workbook.active
 6
 7     data = []
 8     for row in sheet.iter_rows(min_row=2, values_only=True):
 9         # 去除品牌占有率和好评率中的百分号
10         row = list(row)
11         row[2] = row[2].replace('%', '')
12         row[3] = row[3].replace('%', '')
13         data.append(row)
14
15     return data
16
17
18 def write_excel_file(data, new_file_path):
19     workbook = openpyxl.Workbook()
20     sheet = workbook.active
21
22     # 写入列名
23     header = ['排名', '品牌', '品牌占有率', '好评率']
24     sheet.append(header)
25
26     # 写入处理后的数据
27     for row in data:
28         sheet.append(row)
29
30     # 设置列宽
31     column_widths = [8, 20, 15, 10]  # 每列的宽度
32     for i, width in enumerate(column_widths, 1):
33         column_letter = openpyxl.utils.get_column_letter(i)
34         sheet.column_dimensions[column_letter].width = width
35
36     # 保存新文件
37     workbook.save(new_file_path)
38
39
40 if __name__ == "__main__":
41     file_path = r'D:\Edge download\brands.xlsx'
42     new_file_path = r'D:\Edge download\cleaned_brands.xlsx'
43     # 读取Excel文件并进行数据清洗
44     data = read_excel_file(file_path)
45     # 将清洗后的数据写入新文件
46     write_excel_file(data, new_file_path)
47     print("文件处理完成,清洗后的数据已保存为新文件")
清洗后的数据
3.数据分析与可视化
(1)以下是以下是热门固态硬盘排行的数据分析与可视化的代码
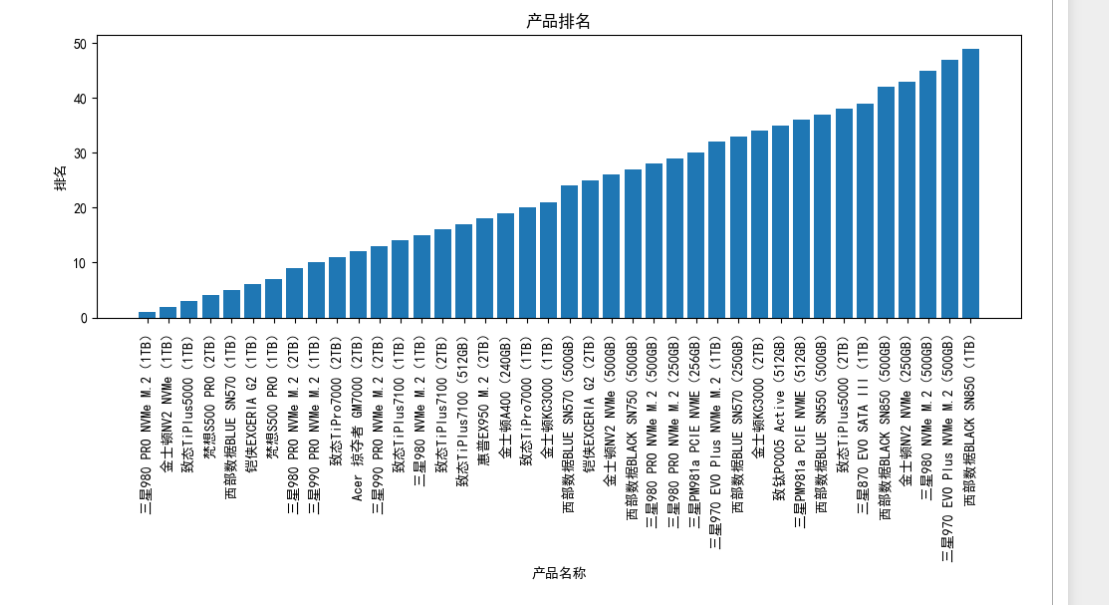
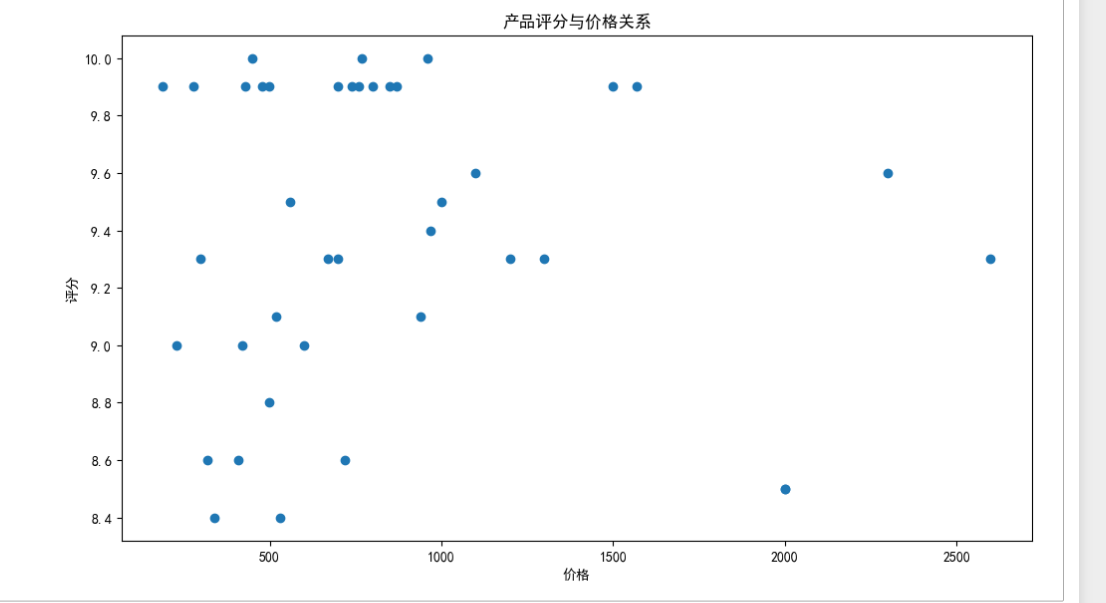
 1 import pandas as pd
 2 import matplotlib.pyplot as plt
 3 from pylab import mpl
 4
 5 # 设置显示中文字体
 6 mpl.rcParams["font.sans-serif"] = ["SimHei"]
 7
 8 # 读取清洗后的数据
 9 input_file = 'D:\\Edge download\\cleaned_product_data.xlsx'
10
11 with pd.ExcelFile(input_file) as xls:
12     df = pd.read_excel(xls)
13
14     # 执行可视化分析
15     # 在这里,您可以添加特定的可视化代码
16     # 例如,可以创建柱状图、折线图、散点图等
17
18     # 设置全局绘图参数
19     plt.rcParams['axes.formatter.useoffset'] = False
20
21     # 产品排名的柱状图
22     plt.figure(figsize=(10, 6))
23     plt.bar(df['产品名称'], df['排名'])
24     plt.xlabel('产品名称')
25     plt.ylabel('排名')
26     plt.title('产品排名')
27     plt.xticks(rotation=90)
28     plt.tight_layout()
29     plt.show()
30
31     # 产品价格的直方图
32     plt.figure(figsize=(10, 6))
33     plt.hist(df['价格'], bins=10)
34     plt.xlabel('价格')
35     plt.ylabel('频数')
36     plt.title('产品价格分布')
37     plt.tight_layout()
38     plt.show()
39
40     # 产品评分与价格关系的散点图
41     plt.figure(figsize=(10, 6))
42     plt.scatter(df['价格'], df['评分'])
43     plt.xlabel('价格')
44     plt.ylabel('评分')
45     plt.title('产品评分与价格关系')
46     plt.tight_layout()
47     plt.show()
以下是可视化图表(按照程序运行后的顺序排放)

(2)以下是固态硬盘品牌排行的数据清分析与可视化的代码
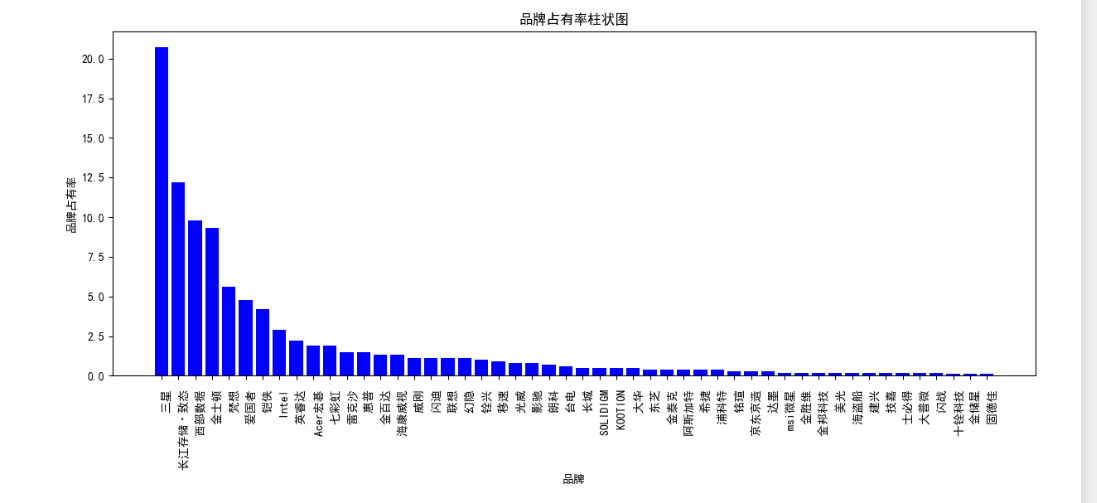
 1 import pandas as pd
 2 import matplotlib.pyplot as plt
 3 from pylab import mpl
 4
 5 # 设置显示中文字体
 6 mpl.rcParams["font.sans-serif"] = ["SimHei"]
 7
 8 def visualize_data(file_path):
 9     # 读取Excel文件
10     df = pd.read_excel(file_path)
11
12     # 绘制柱状图
13     plt.figure(figsize=(12, 6))
14     plt.bar(df['品牌'], df['品牌占有率'], color='blue')
15     plt.xlabel('品牌')
16     plt.ylabel('品牌占有率')
17     plt.title('品牌占有率柱状图')
18     plt.xticks(rotation=90)
19     plt.tight_layout()
20     plt.show()
21
22     # 绘制折线图
23     plt.figure(figsize=(12, 6))
24     plt.plot(df['品牌'], df['好评率'], marker='o', color='red', linewidth=2)
25     plt.xlabel('品牌')
26     plt.ylabel('好评率')
27     plt.title('好评率折线图')
28     plt.xticks(rotation=90)
29     plt.tight_layout()
30     plt.show()
31
32 if __name__ == "__main__":
33     file_path = r'D:\Edge download\cleaned_brands.xlsx'
34     # 可视化处理数据
35     visualize_data(file_path)
以下是可视化图表(按照程序运行后的顺序排放)

4.将以上各部分的代码汇总,附上完整程序代码
(1)热门固态硬盘排行
  1 #以下是热门固态硬盘排行的全部代码
  2 #数据采集
  3 import csv
  4 import os
  5 import requests
  6 from bs4 import BeautifulSoup
  7 import pandas as pd
  8 #用于读取/编写Excel 2010 xlsx/xlsm/xltx/xltm文件的Python库
  9 from openpyxl import Workbook
 10 #与pandas交互使用
 11 from openpyxl.utils.dataframe import dataframe_to_rows
 12
 13 def crawl_function(url, save_path):
 14
 15     headers = {
 16         'User-Agent': 'Mozilla/5.0 (Windows NT 10.0; Win64; x64) AppleWebKit/537.36 (KHTML, like Gecko) '
 17                       'Chrome/112.0.0.0 Safari/537.36 Edg/112.0.1722.64'
 18     }
 19     # 解决requests请求反爬取
 20     response = requests.get(url, headers=headers)
 21
 22     if response.status_code == 200:
 23         # 200代表OK请求成功
 24         soup = BeautifulSoup(response.content, 'html.parser')
 25
 26         section_head = soup.find('div', class_='section__head clearfix')
 27         titles = section_head.find_all('h3')
 28
 29         for title in titles:
 30             print('爬取内容:', title.get_text().strip())
 31
 32         product_names = soup.find_all('div', class_='rank__name')#名称
 33         product_ranks = soup.find_all('div', class_='rank__number')#排名
 34         product_prices = soup.find_all('div', class_='rank__price')#价格
 35         product_ratings = soup.find_all('div', class_='score clearfix')#评分
 36
 37         # 创建DataFrame用于存储数据
 38         data = []
 39         for name, rank, price, rating in zip(product_names, product_ranks, product_prices, product_ratings):
 40             product_name = name.get_text().strip()
 41             # 去掉原本带着的¥符号
 42             product_price = price.get_text().strip().replace('¥', '')
 43
 44             # 处理排名的情况
 45             rank_class = rank.find('i', class_='crown-icon')
 46             if rank_class:
 47                 # 如果排名是皇冠图标,则代表第一名
 48                 product_rank = '1'
 49             else:
 50                 product_rank = rank.get_text().strip()
 51
 52             # 处理评分的情况
 53             rating_element = rating.find('span')
 54             if rating_element:
 55                 rating_value_with_unit = rating_element.get_text().strip()
 56                 # 去掉“分”字只留下数值
 57                 rating_value = rating_value_with_unit.replace('分', '')
 58             else:
 59                 rating_value = '暂无评分'
 60
 61             data.append([product_name, product_price, product_rank, rating_value])
 62
 63         df = pd.DataFrame(data, columns=['产品名称', '价格', '排名', '评分'])
 64
 65         # 创建Excel文件并保存DataFrame
 66         workbook = Workbook()
 67         worksheet = workbook.active
 68         for row in dataframe_to_rows(df, index=False, header=True):
 69             worksheet.append(row)
 70
 71         # 调整产品名称列的宽度
 72         max_width = 0
 73         for cell in worksheet['A']:
 74             if cell.value:
 75                 if len(str(cell.value)) > max_width:
 76                     max_width = len(str(cell.value))
 77         worksheet.column_dimensions['A'].width = max_width
 78
 79         # 获取文件夹路径
 80         folder_path = os.path.dirname(save_path)
 81         # 创建文件夹(如果不存在)
 82         os.makedirs(folder_path, exist_ok=True)
 83
 84         # 检查该文件是否已经存在
 85         if os.path.isfile(save_path):
 86             print(f"文件已存在,已被覆盖: {save_path}")
 87             #用于提示该程序的第2-n次运行
 88
 89         # 保存Excel文件
 90         workbook.save(save_path)
 91
 92         #网页请求成功结果及失败提示
 93         print(f"数据已保存为 {save_path} 文件")
 94     else:
 95         print('请求失败:', response.status_code)
 96
 97 if __name__ == "__main__":
 98     # 爬取网页地址
 99     url = 'https://top.zol.com.cn/compositor/626/cpu.html'
100     #文件存储地址及命名
101     save_path = 'D:\\Edge download\\product_data.xlsx'
102     #调用爬取函数
103     crawl_function(url, save_path)
104
105 #数据清洗与处理
106 import pandas as pd
107 from openpyxl import load_workbook
108
109 # 读取Excel文件
110 input_file = 'D:\\Edge download\\product_data.xlsx'
111 df = pd.read_excel(input_file)
112
113 # 删除'价格'列中带有中文字符的产品
114 df = df[~df['价格'].str.contains('[\u4e00-\u9fff]')]
115
116 # 删除'评分'列中带有中文字符的产品
117 df = df[~df['评分'].str.contains('[\u4e00-\u9fff]')]
118
119 # 将清理后的数据保存到新文件中
120 output_file = 'D:\\Edge download\\cleaned_product_data.xlsx'
121 df.to_excel(output_file, index=False)
122
123 # 调整产品名称列的宽度
124 book = load_workbook(output_file)
125 worksheet = book.active
126 max_width = 0
127 for cell in worksheet['A']:
128     if cell.value:
129         if len(str(cell.value)) > max_width:
130             max_width = len(str(cell.value))
131 worksheet.column_dimensions['A'].width = max_width
132
133 book.save(output_file)
134 book.close()
135
136 print(f"清理后的数据已保存到 {output_file}")
137
138 #数据分析及可视化
139 import pandas as pd
140 import matplotlib.pyplot as plt
141 from pylab import mpl
142
143 # 设置显示中文字体
144 mpl.rcParams["font.sans-serif"] = ["SimHei"]
145
146 # 读取清洗后的数据
147 input_file = 'D:\\Edge download\\cleaned_product_data.xlsx'
148
149 with pd.ExcelFile(input_file) as xls:
150     df = pd.read_excel(xls)
151
152     # 执行可视化分析
153     # 在这里,您可以添加特定的可视化代码
154     # 例如,可以创建柱状图、折线图、散点图等
155
156     # 设置全局绘图参数
157     plt.rcParams['axes.formatter.useoffset'] = False
158
159     # 产品排名的柱状图
160     plt.figure(figsize=(10, 6))
161     plt.bar(df['产品名称'], df['排名'])
162     plt.xlabel('产品名称')
163     plt.ylabel('排名')
164     plt.title('产品排名')
165     plt.xticks(rotation=90)
166     plt.tight_layout()
167     plt.show()
168
169     # 产品价格的直方图
170     plt.figure(figsize=(10, 6))
171     plt.hist(df['价格'], bins=10)
172     plt.xlabel('价格')
173     plt.ylabel('频数')
174     plt.title('产品价格分布')
175     plt.tight_layout()
176     plt.show()
177
178     # 产品评分与价格关系的散点图
179     plt.figure(figsize=(10, 6))
180     plt.scatter(df['价格'], df['评分'])
181     plt.xlabel('价格')
182     plt.ylabel('评分')
183     plt.title('产品评分与价格关系')
184     plt.tight_layout()
185     plt.show()
(2)固态硬盘品牌排行
  1 #以下是固态硬盘品牌排行全部代码
  2 #数据采集
  3 import os
  4 import requests
  5 from bs4 import BeautifulSoup
  6 from openpyxl import Workbook
  7
  8 def brand_crawl_function(url, file_path):
  9     response = requests.get(url)
 10
 11     if response.status_code == 200:
 12         soup = BeautifulSoup(response.text, 'html.parser')
 13         brand_list = soup.find_all('div', class_='rank-list__cell')
 14
 15         # 创建一个新的Excel文件
 16         workbook = Workbook()
 17         sheet = workbook.active
 18
 19         # 写入表头
 20         header = ['排名', '品牌', '品牌占有率', '好评率']
 21         sheet.append(header)
 22
 23         for i in range(7, len(brand_list), 7):  # 从索引为7开始,跳过第一行
 24             rank = brand_list[i]
 25             rank_class = rank.find('i', class_='crown-icon')
 26             if rank_class:
 27                 product_rank = '1'  # 如果排名是皇冠图标,则代表第一名
 28             else:
 29                 product_rank = rank.get_text().strip()
 30
 31             brand_name = brand_list[i+1].text
 32             brand_occupancy = brand_list[i+3].text
 33             brand_positive_rate = brand_list[i+5].text
 34
 35             # 写入每个品牌的信息
 36             row = [product_rank, brand_name, brand_occupancy, brand_positive_rate]
 37             sheet.append(row)
 38
 39         # 保存Excel文件到指定路径
 40         directory = os.path.dirname(file_path)
 41         if not os.path.exists(directory):
 42             os.makedirs(directory)
 43
 44         if os.path.isfile(file_path):
 45             print(f"文件已存在,已被覆盖: {file_path}")
 46
 47         workbook.save(file_path)
 48         print(f"数据已保存为 {file_path} 文件")
 49     else:
 50         print('请求失败:', response.status_code)
 51
 52
 53 if __name__ == "__main__":
 54     # 调用函数进行爬取并保存到Excel文件
 55     url = 'https://top.zol.com.cn/compositor/626/manu_attention.html'
 56     file_path = r'D:\Edge download\brands.xlsx'
 57     brand_crawl_function(url, file_path)
 58
 59 #数据清洗与处理
 60 import openpyxl
 61
 62 def read_excel_file(file_path):
 63     workbook = openpyxl.load_workbook(file_path)
 64     sheet = workbook.active
 65
 66     data = []
 67     for row in sheet.iter_rows(min_row=2, values_only=True):
 68         # 去除品牌占有率和好评率中的百分号
 69         row = list(row)
 70         row[2] = row[2].replace('%', '')
 71         row[3] = row[3].replace('%', '')
 72         data.append(row)
 73
 74     return data
 75
 76
 77 def write_excel_file(data, new_file_path):
 78     workbook = openpyxl.Workbook()
 79     sheet = workbook.active
 80
 81     # 写入列名
 82     header = ['排名', '品牌', '品牌占有率', '好评率']
 83     sheet.append(header)
 84
 85     # 写入处理后的数据
 86     for row in data:
 87         sheet.append(row)
 88
 89     # 设置列宽
 90     column_widths = [8, 20, 15, 10]  # 每列的宽度
 91     for i, width in enumerate(column_widths, 1):
 92         column_letter = openpyxl.utils.get_column_letter(i)
 93         sheet.column_dimensions[column_letter].width = width
 94
 95     # 保存新文件
 96     workbook.save(new_file_path)
 97
 98
 99 if __name__ == "__main__":
100     file_path = r'D:\Edge download\brands.xlsx'
101     new_file_path = r'D:\Edge download\cleaned_brands.xlsx'
102     # 读取Excel文件并进行数据清洗
103     data = read_excel_file(file_path)
104     # 将清洗后的数据写入新文件
105     write_excel_file(data, new_file_path)
106     print("文件处理完成,清洗后的数据已保存为新文件")
107
108 #数据分析及可视化
109 import pandas as pd
110 import matplotlib.pyplot as plt
111 from pylab import mpl
112
113 # 设置显示中文字体
114 mpl.rcParams["font.sans-serif"] = ["SimHei"]
115
116 def visualize_data(file_path):
117     # 读取Excel文件
118     df = pd.read_excel(file_path)
119
120     # 绘制柱状图
121     plt.figure(figsize=(12, 6))
122     plt.bar(df['品牌'], df['品牌占有率'], color='blue')
123     plt.xlabel('品牌')
124     plt.ylabel('品牌占有率')
125     plt.title('品牌占有率柱状图')
126     plt.xticks(rotation=90)
127     plt.tight_layout()
128     plt.show()
129
130     # 绘制折线图
131     plt.figure(figsize=(12, 6))
132     plt.plot(df['品牌'], df['好评率'], marker='o', color='red', linewidth=2)
133     plt.xlabel('品牌')
134     plt.ylabel('好评率')
135     plt.title('好评率折线图')
136     plt.xticks(rotation=90)
137     plt.tight_layout()
138     plt.show()
139
140 if __name__ == "__main__":
141     file_path = r'D:\Edge download\cleaned_brands.xlsx'
142     # 可视化处理数据
143     visualize_data(file_path)
五、总结
在经过对中关村在线热门固态硬盘排行和固态硬盘品牌排行的爬取和可视化分析后,我们可以看出长江存储对面前SSD市场的影响,它的创新以及技术突破打破了以前的市场及技术垄断,让我们来到了一元一G的时代,越来越多的厂家和品牌正在崛起,其中也有致态、光威、爱国者等一批国产厂商也在崛起,他们不停的改变着中国SSD市场的布局。目前,长江存储正在通过技术为各大存储品牌服务,进而带动整个国内SSD市场的变化,这些都可以从具体的品牌和产品中体现出来,也让消费者可以根据自己的需求进行更多的选择。