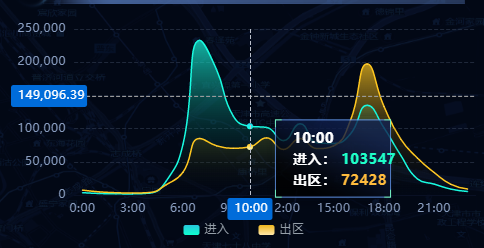
样式如图
使用:
<echartLine
ref="day30Echat"
:xAxis="timeList"
:xlist="xlist30Day"
:xlist2="xlist230Day"
:smooth="true"
></echartLine>
js方法:
get30(area) {
let json = {
carType: this.carType, //大分类
owningLocationStr: area //小区域
};
leadCockpitApi(json).then(res => {
if (res.data.code == 200) {
this.xlist30Day = res.data.data.outIntegerList;
this.xlist230Day = res.data.data.inIntegerList;
this.$nextTick(() => {
this.$refs.day30Echat.getData();
});
}
});
},
代码如下:
<!--
 * @Description:领导驾驶舱-新版-曲线折现图组件
 * @Author:
 * @LastEditTime: 2023-02-21 17:38:01
-->
<template>
  <div class="echarts" id="echat" ref="echat"></div>
</template>

<script>
export default {
  name: 'titleBar',
  components: {},
  props: {
    xAxis: {
      type: Array //x轴刻度
    },
    xlist: {
      type: Array //线1数值
    },
    xlist2: {
      type: Array //线2数值
    },
    smooth: {
      type: Boolean //曲线折线
    }
  },
  data() {
    return {};
  },
  methods: {
    getData() {
      setTimeout(_ => {
        let myChart = this.$echarts.init(this.$refs.echat);
        myChart.resize();
        myChart.setOption({
          grid: {
            left: '10',
            top: '20',
            right: '0',
            bottom: '26',
            containLabel: true
          },
          xAxis: {
            type: 'category',
            axisLine: {
              // 改变x轴颜色
              lineStyle: {
                color: '#091024',
                width: 1
              }
            },
            //坐标轴刻度设置
            axisTick: {
              //隐藏刻度线
              show: false,
              //设置刻度线与标签对齐
              alignWithLabel: true
            },
            axisLabel: {
              color: '#899DBF'
            },
            data: this.xAxis
          },
          yAxis: {
            type: 'value',
            splitLine: {
              //修改背景线条样式
              show: true, //是否展示
              lineStyle: {
                color: 'rgba(55, 66, 88, 0.54)', //线条颜色
                type: 'dashed' //线条样式,默认是实现,dashed是虚线
              }
            },
            axisLabel: {
              color: '#899DBF'
            }
          },
          //线条相关
          series: [
            {
              name: '进入',
              data: this.xlist2,
              //线条颜色
              lineStyle: {
                color: '#16E5CC',
                width: 1.5
              },
              type: 'line', //平滑效果
              color: ['#16E5CC'],
              smooth: this.smooth,
              //拐点样式
              itemStyle: {
                color: {
                  type: 'linear',
                  x: 0, //右
                  y: 0, //下
                  x2: 0, //左
                  y2: 1, //上
                  colorStops: [
                    {
                      offset: 0,
                      color: '#28C6DB' // 0% 处的颜色
                    },
                    {
                      offset: 1,
                      color: '#0EFFCF' // 100% 处的颜色
                    }
                  ]
                }
              },
              emphasis: {
                color: '#030714', // 圆心内颜色
                borderColor: '#16E5CC', // 点边线的颜色
                borderWidth: 2 //  拐点边框宽度
              },
              symbolSize: 1,
              symbol: 'circle', //圆 不写默认空心
              areaStyle: {
                color: new this.$echarts.graphic.LinearGradient(0, 0, 0, 1, [
                  {
                    offset: 0,
                    color: '#16E5CC'
                  },
                  {
                    offset: 1,
                    color: 'transparent'
                  }
                ])
              }
            },
            {
              name: '出区',
              data: this.xlist,
              //线条颜色
              lineStyle: {
                color: '#EDB51D',
                width: 1.5
              },
              type: 'line', //平滑效果
              color: ['#EDB51D'],
              smooth: this.smooth,
              //拐点样式
              itemStyle: {
                color: {
                  type: 'linear',
                  x: 0, //右
                  y: 0, //下
                  x2: 0, //左
                  y2: 1, //上
                  colorStops: [
                    {
                      offset: 0,
                      color: '#EDB51D' // 0% 处的颜色
                    },
                    {
                      offset: 1,
                      color: '#FFE7A8' // 100% 处的颜色
                    }
                  ]
                }
              },
              emphasis: {
                //突出效果配置(鼠标置于拐点上时)
                color: '#030714', //hover拐点颜色定义
                borderColor: '#EDB51D', //  拐点边框颜色
                borderWidth: 2 //  拐点边框宽度
              },
              // itemStyle: {
              //   emphasis: {
              //     //突出效果配置(鼠标置于拐点上时)
              //     color: '#030714', //hover拐点颜色定义
              //     borderColor: '#EDB51D', //  拐点边框颜色
              //     borderWidth: 2 //  拐点边框宽度
              //   }
              // },
              symbolSize: 1,
              symbol: 'circle',
              areaStyle: {
                color: new this.$echarts.graphic.LinearGradient(0, 0, 0, 1, [
                  {
                    offset: 0,
                    color: '#EDB51D'
                  },
                  {
                    offset: 1,
                    color: 'transparent'
                  }
                ])
              }
            }
          ],
          /* 设置图例样式 */
          legend: {
            x: 'center',
            y: 'bottom',
            icon: 'roundRect', //图例形状
            itemHeight: 10, // 图例icon高度
            itemWidth: 16, // 图例icon宽度
            textStyle: {
              color: '#959FA8'
            },
            itemGap: 30, //图例间距
            data: ['进入', '出区']
          },
          //悬浮框
          tooltip: {
            trigger: 'axis',
            borderColor: 'transparent', //'#4380D1',
            // alwaysShowContent: true, // 是否永远显示提示框内容,默认情况下在移出可触发提示框区域后一定时间后隐藏
            triggerOn: 'mousemove', // 提示框触发的条件
            confine: true, // 是否将 tooltip 框限制在图表的区域内
            backgroundColor: 'transparent', //'#fff', // 提示框浮层的背景颜色
            padding: 0, // 提示框浮层内边距,单位px
            position: 'right',
            textStyle: {
              color: '#fff', // 文字的颜色
              fontWeight: '600'
            },
            formatter: function(params) {
              var htmlStr =
                '<div class="toolStyle" style="height: auto;max-height: 240px;width:135px;"><p>' +
                params[0].axisValue +
                '</p>';
              var color = ['#1EFFC9', '#FFBB3D'];
              for (var i = 0; i < params.length; i++) {
                htmlStr +=
                  '<p style="color: #fff;">' +
                  params[i].seriesName +
                  ': <span style="color:' +
                  color[i] +
                  '">' +
                  params[i].value +
                  '</span></p>';
              }
              htmlStr += '</div>';
              return htmlStr;
            },
            axisPointer: {
              // 坐标轴虚线
              type: 'cross',
              color: 'red',
              label: {
                backgroundColor: '#006CDA'
              }
            }
          }
        });
        window.addEventListener('resize', () => {
          myChart.resize();
        });
      }, 1000);
    }
  }
};
</script>
<style lang="scss" scoped>
.echarts {
  width: 100%;
  height: 100%;
}
</style>