一、安装grafana
yum install -y https://dl.grafana.com/enterprise/release/grafana-enterprise-10.1.4-1.x86_64.rpm
二、启动并设为开机自启
[root@zabbix-server ~]#  systemctl start grafana-server.service
[root@zabbix-server ~]#  systemctl enable grafana-server.service
Synchronizing state of grafana-server.service with SysV service script with /usr/lib/systemd/systemd-sysv-install.
Executing: /usr/lib/systemd/systemd-sysv-install enable grafana-server
Created symlink /etc/systemd/system/multi-user.target.wants/grafana-server.service → /usr/lib/systemd/system/grafana-server.service.

[root@zabbix-server ~]# ss -ntulp | grep 3000
tcp   LISTEN 0      2048               *:3000             *:*    users:(("grafana",pid=5156,fd=9))
三、防火墙开放相关端口
[root@zabbix-server ~]# firewall-cmd --add-service=grafana --permanent
success

[root@zabbix-server ~]# systemctl restart firewalld

[root@zabbix-server ~]# firewall-cmd  --list-all
public (active)
  target: default
  icmp-block-inversion: no
  interfaces: ens160 ens192
  sources:
  services: cockpit dhcpv6-client grafana http https ssh zabbix-agent zabbix-server
  ports:
  protocols:
  forward: no
  masquerade: no
  forward-ports:
  source-ports:
  icmp-blocks:
  rich rules:
四、使用web界面登录
默认账户密码:admin admin

第一次登录需要修改密码

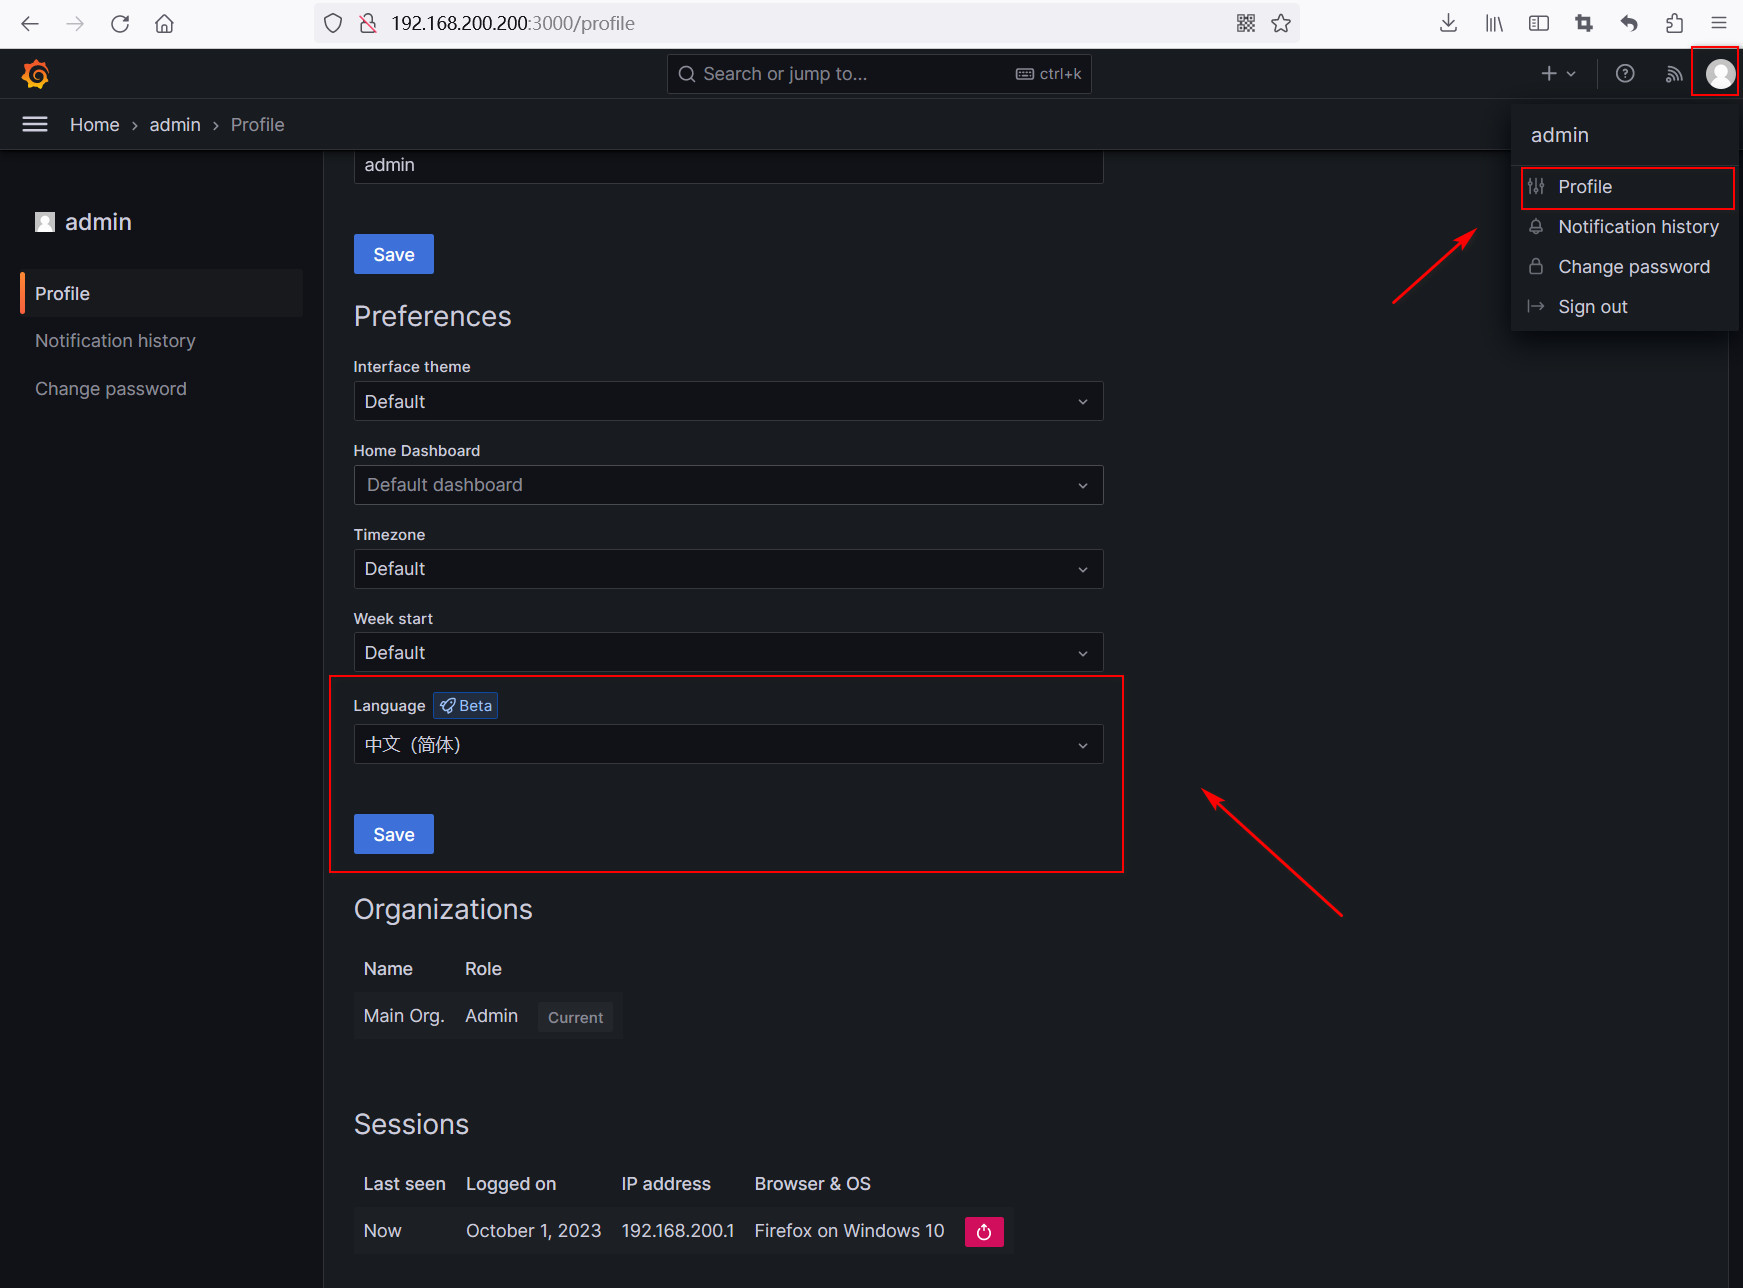
登录进来后显示该页面

设置语言为中文

五、安装zabbix插件
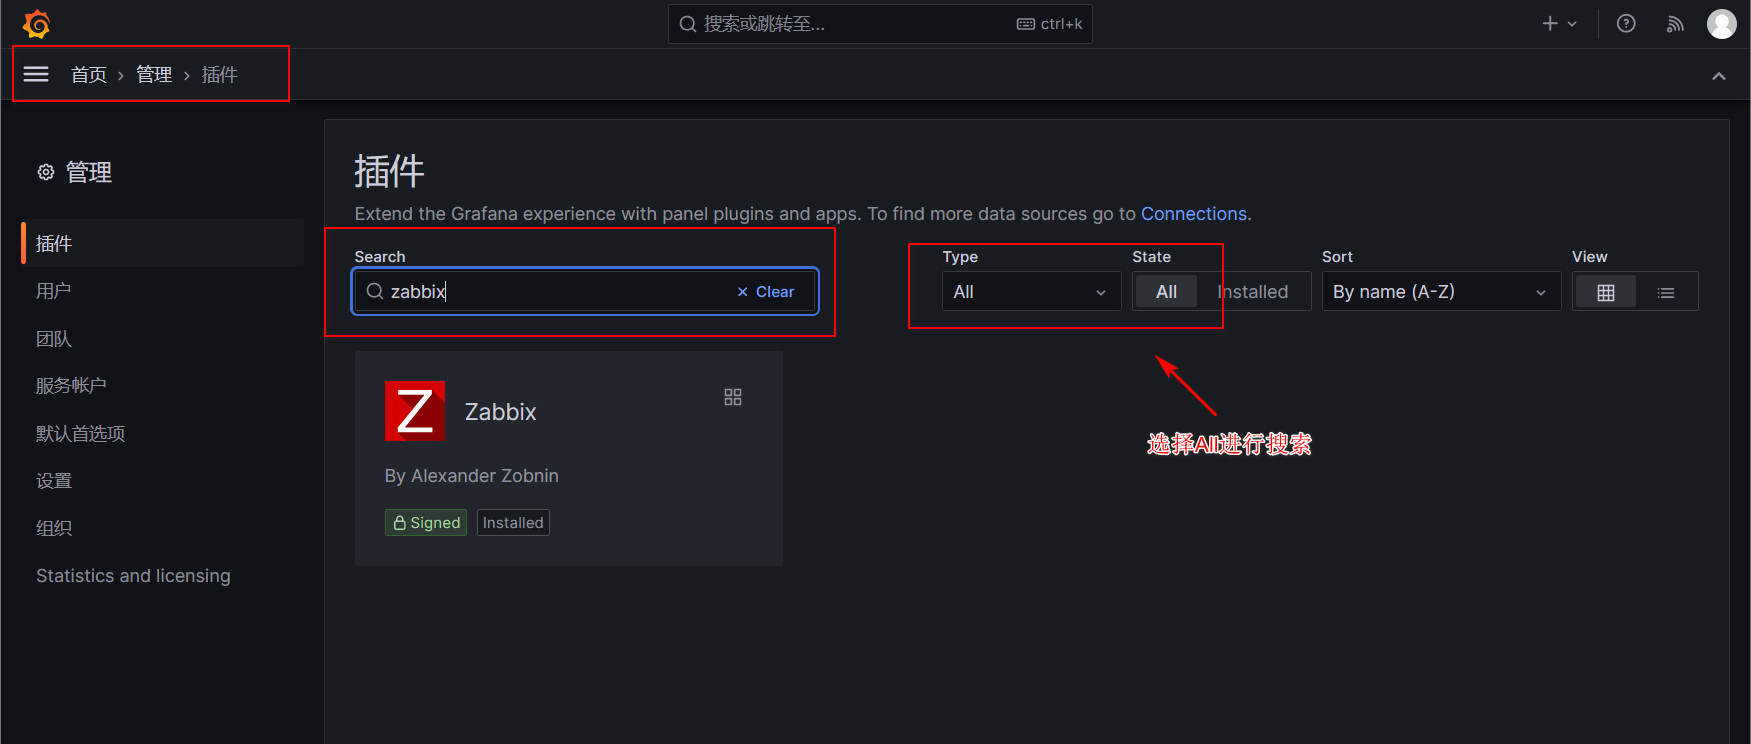
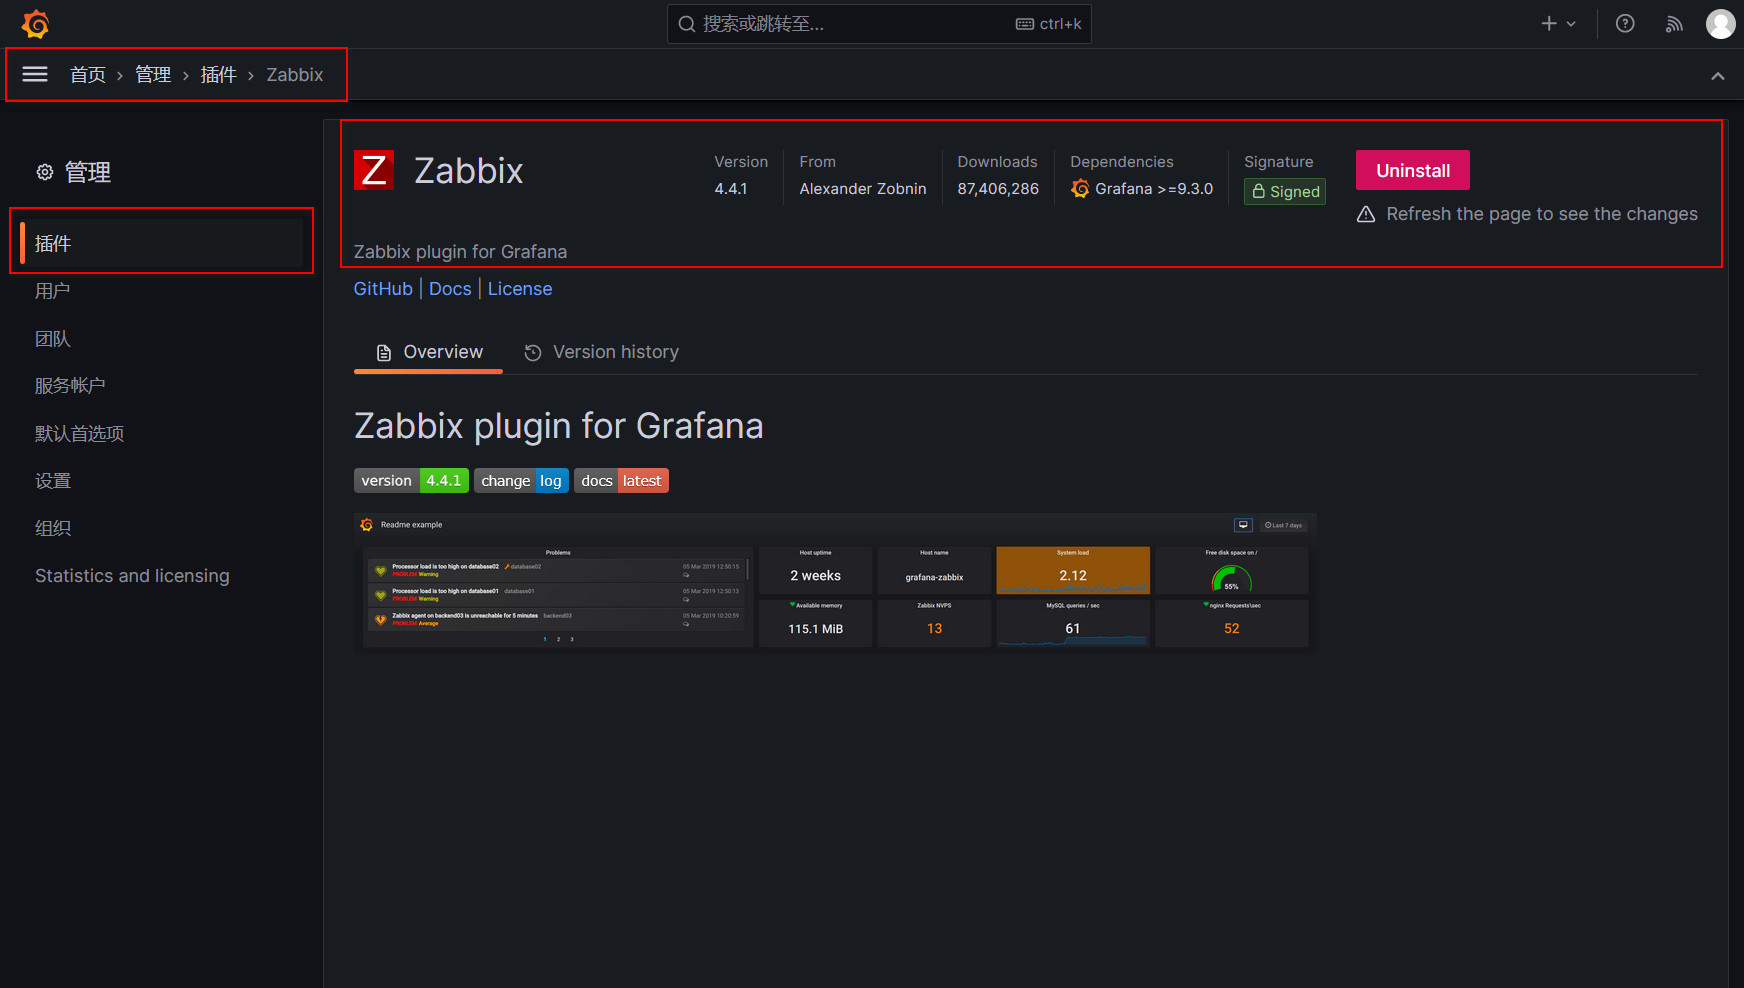
web界面安装
在管理——插件 中搜索zabbix 之后选择安装(搜索时选择所有)
命令行安装插件
安装zabbix插件
grafana-cli plugins install alexanderzobnin-zabbix-app


列出可用插件
grafana-cli plugins list-remote


安装列出的插件
[root@zabbix-server /var/lib/grafana]# grafana-cli plugins ls
installed plugins:
alexanderzobnin-zabbix-app @ 4.4.1
之后重启服务
systemctl restart grafana-server.service
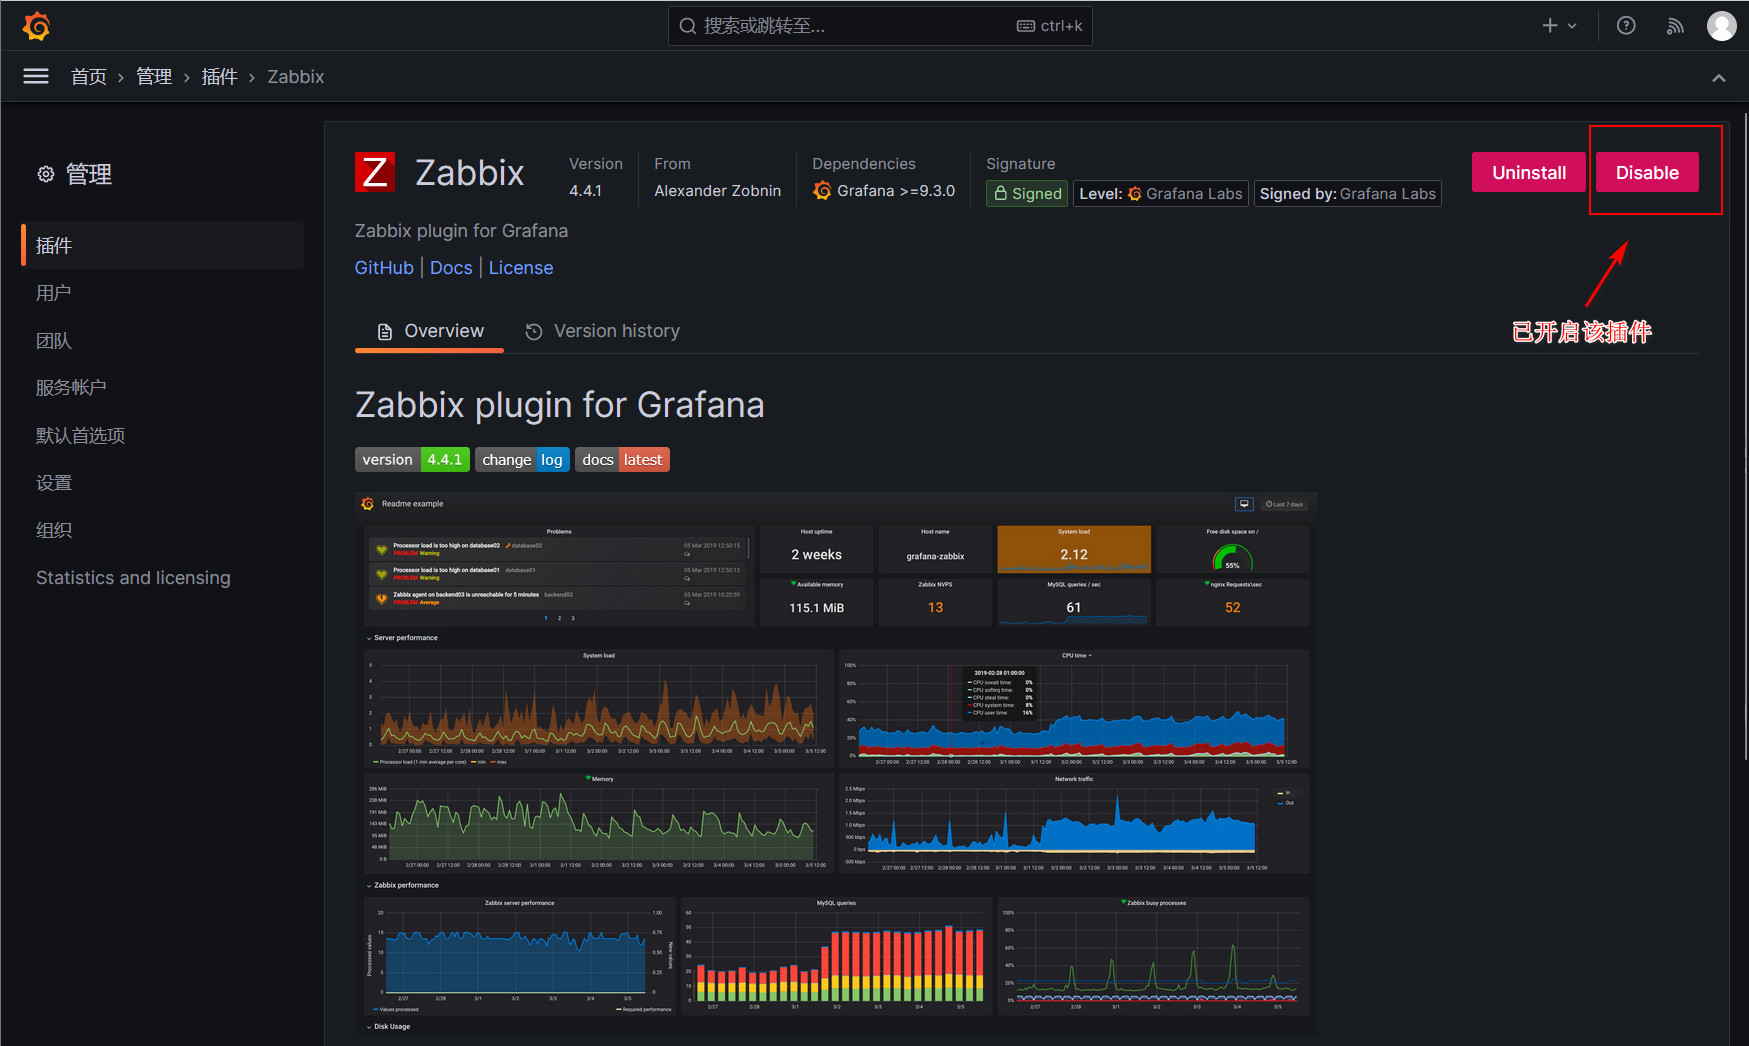
六、开启插件
重启服务后刷新页面右上角会出现Enable的按钮,点击即可开启

七、配置zabbix插件
在Connections中找到zabbix插件进行配置
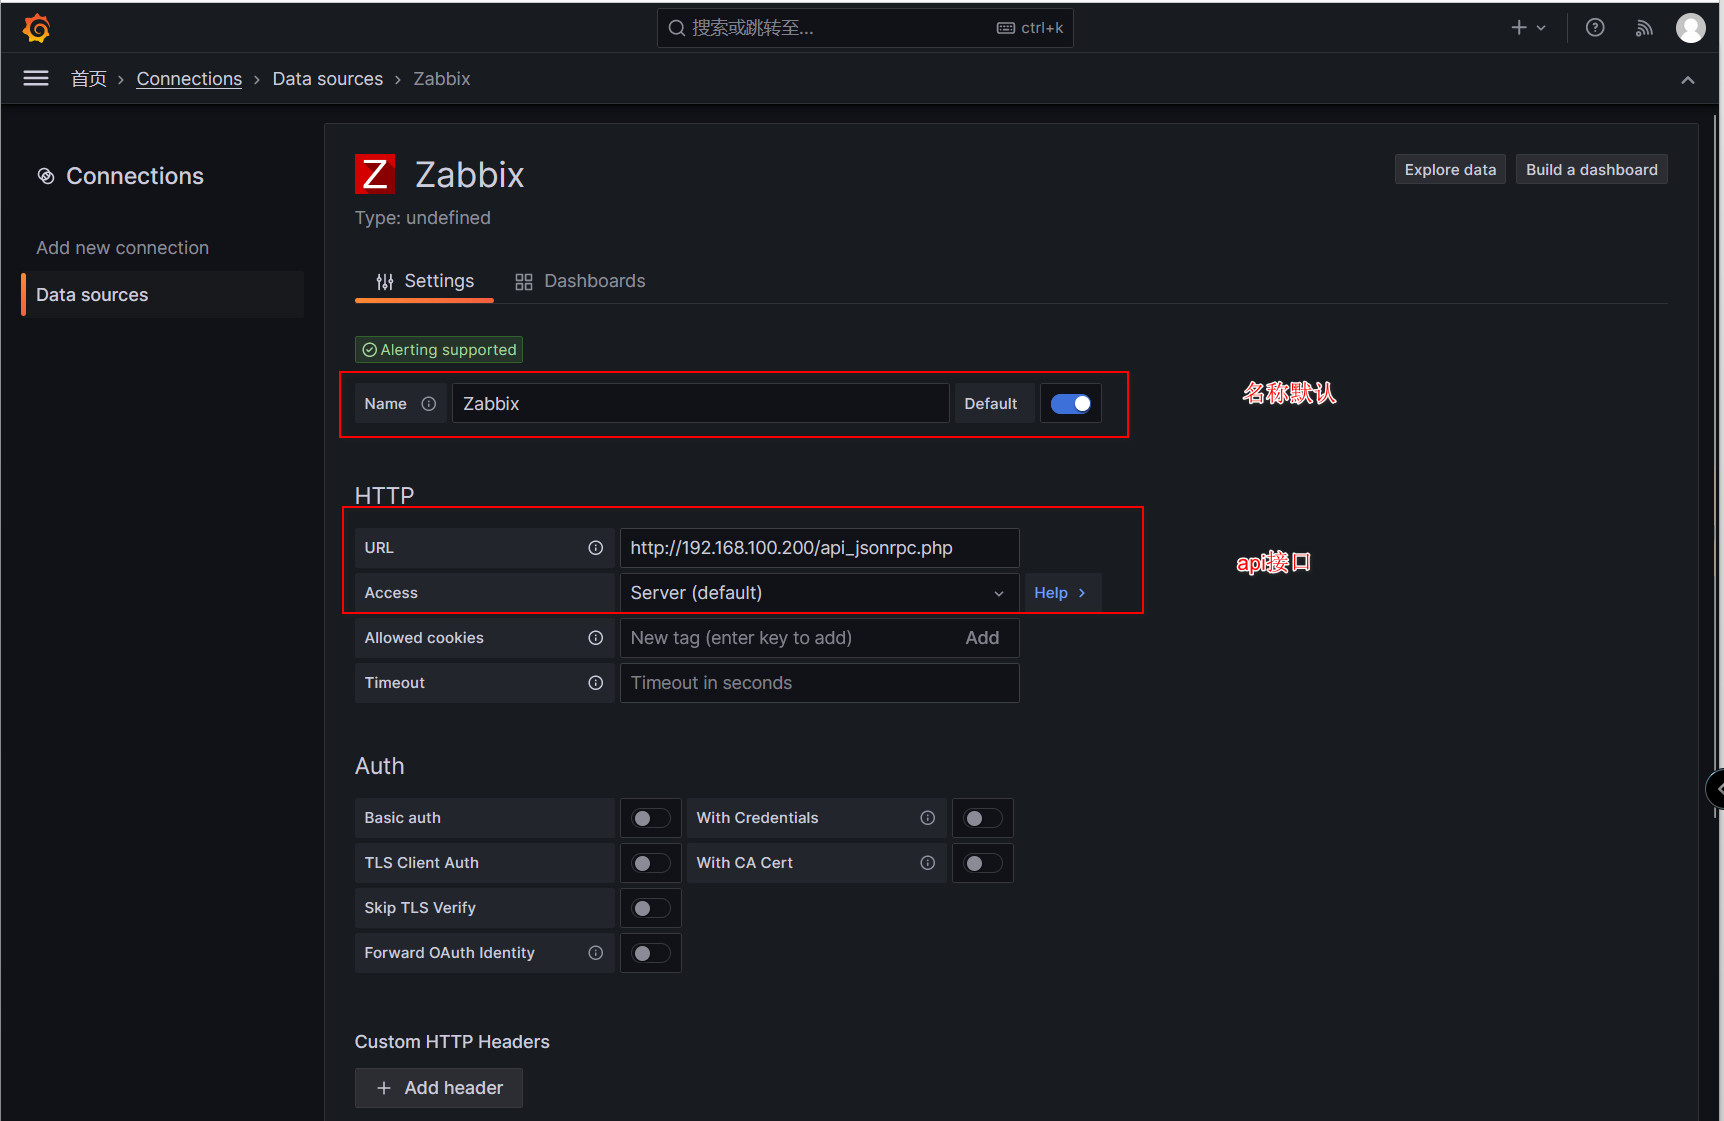

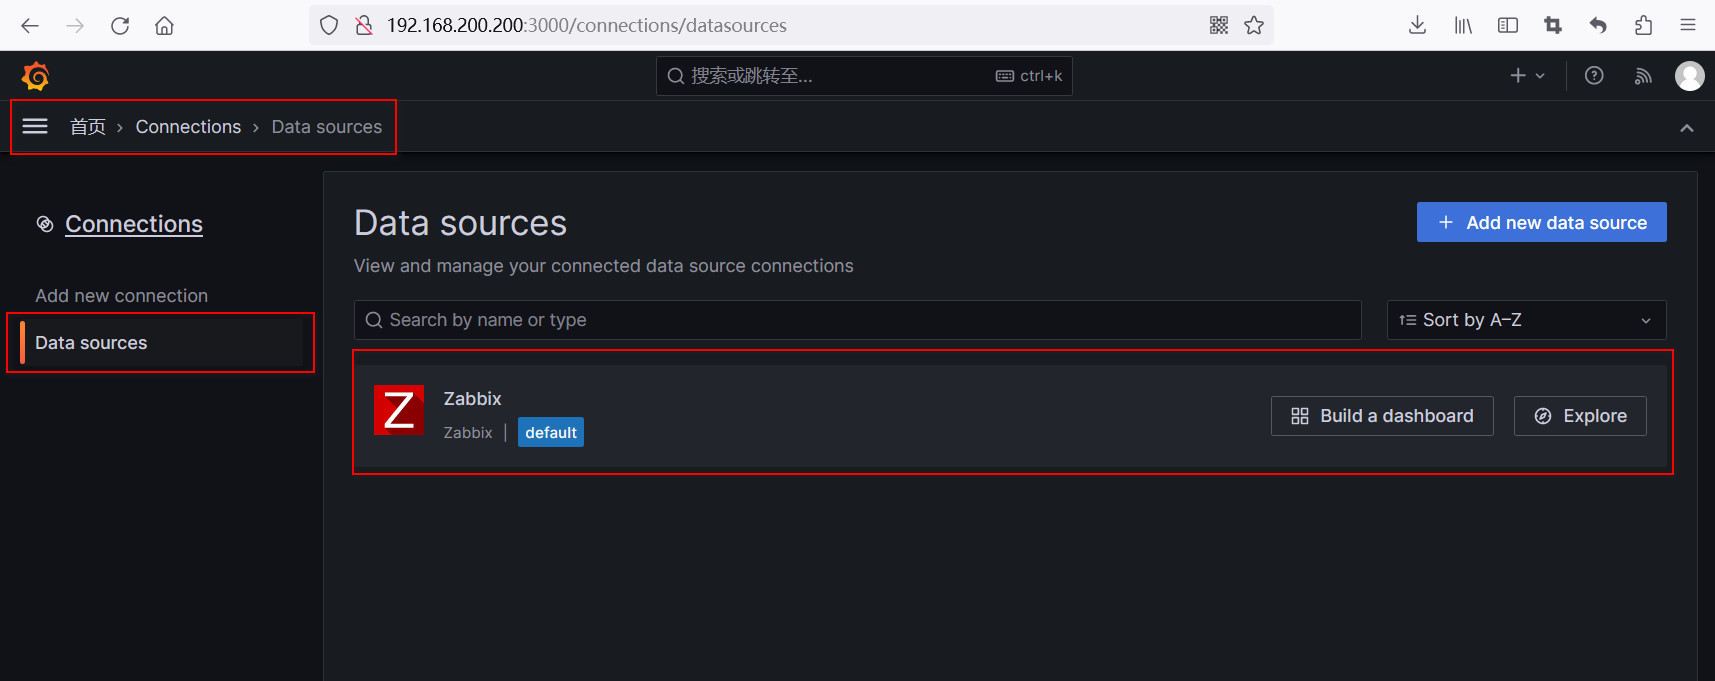
八、添加数据源
在connections——Data sources找到该zabbix插件进行配置
点击Build a dashboard
点击添加可视化

选择zabbix进行添加


添加完点击右上角的保存即可
最终效果:

九、