初学Bokeh:绘制多线条折线图【5】跬步
本例程来自于Bokeh网上教学例程。
在上一个例子中展示了如何绘制只含有一条折线的折线图。在本例子中我们来看如何绘制包含多条折线的折线图。从本质上来说,绘制多条折线,只是在创建绘图对象后在其中添加了多个折线对象而已,整个程序流程与之前的完全相同。
Step1:引用函数figure()和函数show()
from bokeh.plotting import figure, show
Step2:准备数据
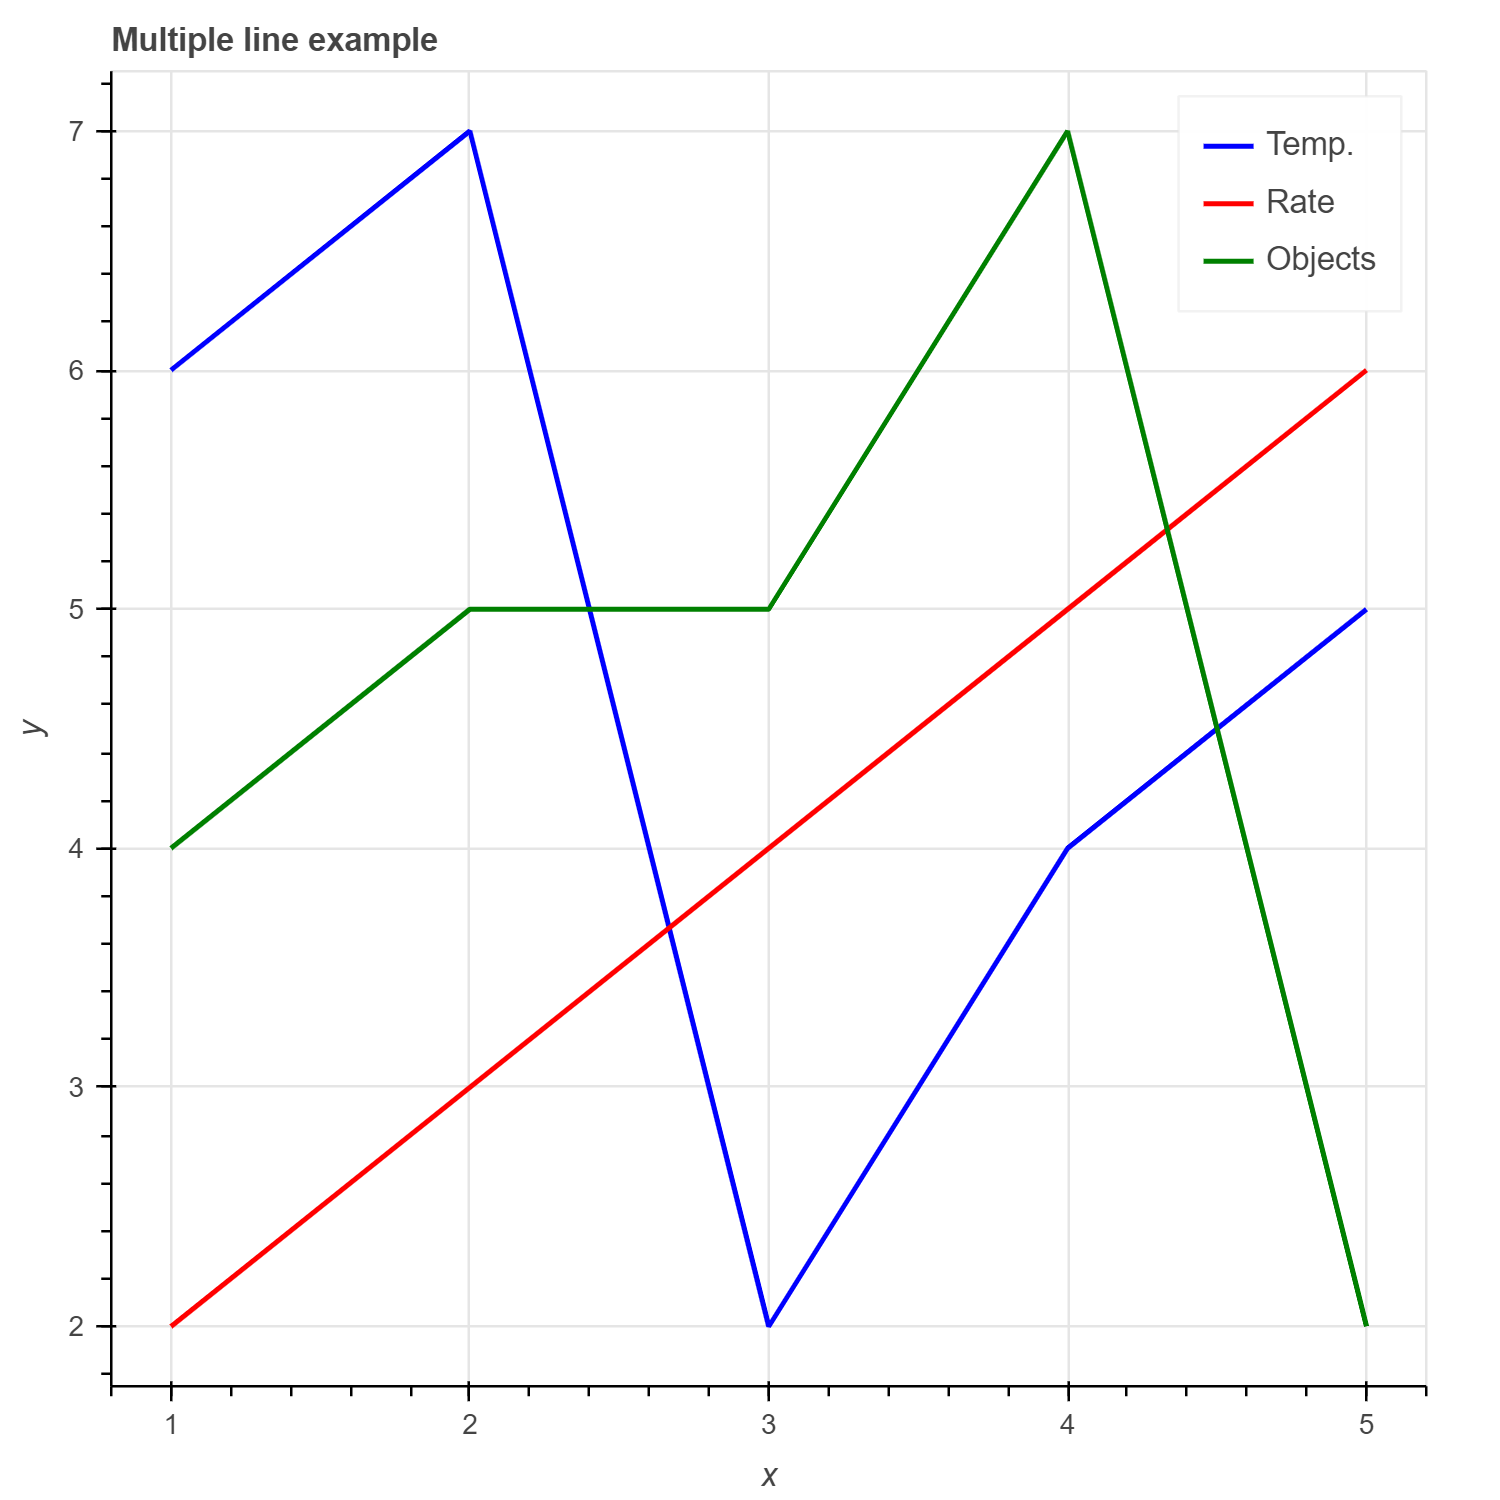
这里需要注意,这里添加了3条折线的数据,
# prepare some data
 x = [1, 2, 3, 4, 5]
 y1 = [6, 7, 2, 4, 5]
 y2 = [2, 3, 4, 5, 6]
 y3 = [4, 5, 5, 7, 2]
Step3:创建绘图对象p
# create a new plot with a title and axis labels
 p = figure(title="Multiple line example", x_axis_label="x", y_axis_label="y")
Step4:添加多条折线
这里每条折线的显示方法与前一个例子完全相同。不同的只是绘图对象p在本例中添加了3个line对象。
# add multiple renderers
 p.line(x, y1, legend_label="Temp.", line_color="blue", line_width=2)
 p.line(x, y2, legend_label="Rate", line_color="red", line_width=2)
 p.line(x, y3, legend_label="Objects", line_color="green", line_width=2)
Step5:显示图像
 # show the results
 show(p)