一般在机器上都会预装valgrind 工具
使用callgrind 工具检查程序的调用情况,例如使用valgrind 来监控sequoiadb 的函数调用关系,可以执行以下命令来启动sequoiadb的某个节点进程
valgrind --tool=callgrind /opt/sequoiadb/bin/sequoiadb -c /opt/sequoiadb/conf/local/11910/
valgrind 会在执行的当前目录新建一个文件,文件的命名规范为 callgrind.out.PID
然后用户就可以像正常使用sequoiadb 一样,登陆进去执行你想要监控的命令,执行完毕后,你在通过ps -ef | grep valgrind 的方式找到对应的进程PID,然后将其退出。
用户可以根据valgrind 生成的监控文件,做一个初步的处理,来简单查看里面的函数调用关系
callgrind_annotate --auto=yes callgrind.out.141064 > callgrind.out.141064.log
新的callgrind.out.141064.log 文件就是一个经过初步统计的监控数据
更加友好的查看方式,是转换为图形化界面进行查看。
使用gprof2dot.py 工具将 valgrind 生成的监控数据转换为 dot 文件
python gprof2dot.py -f callgrind -n10 -s callgrind.out.141064 > callgrind.out.141064.dot
然后再使用 dot 工具,将刚才生成的dot 文件转换为gif 图。
注意,在后面附的资料中,建议转换为 png 格式,但是在楼主的suse环境中,转换为png 个是会报错,所以最终选择转换为gif格式。
dot -Tgif callgrind.out.141064.dot -o callgrind.out.141064.gif
如果是在ubuntu 16.04 环境上执行转换为 png ,就能够通过
dot -Tpng callgrind.out.141064.dot -o callgrind.out.141064.png
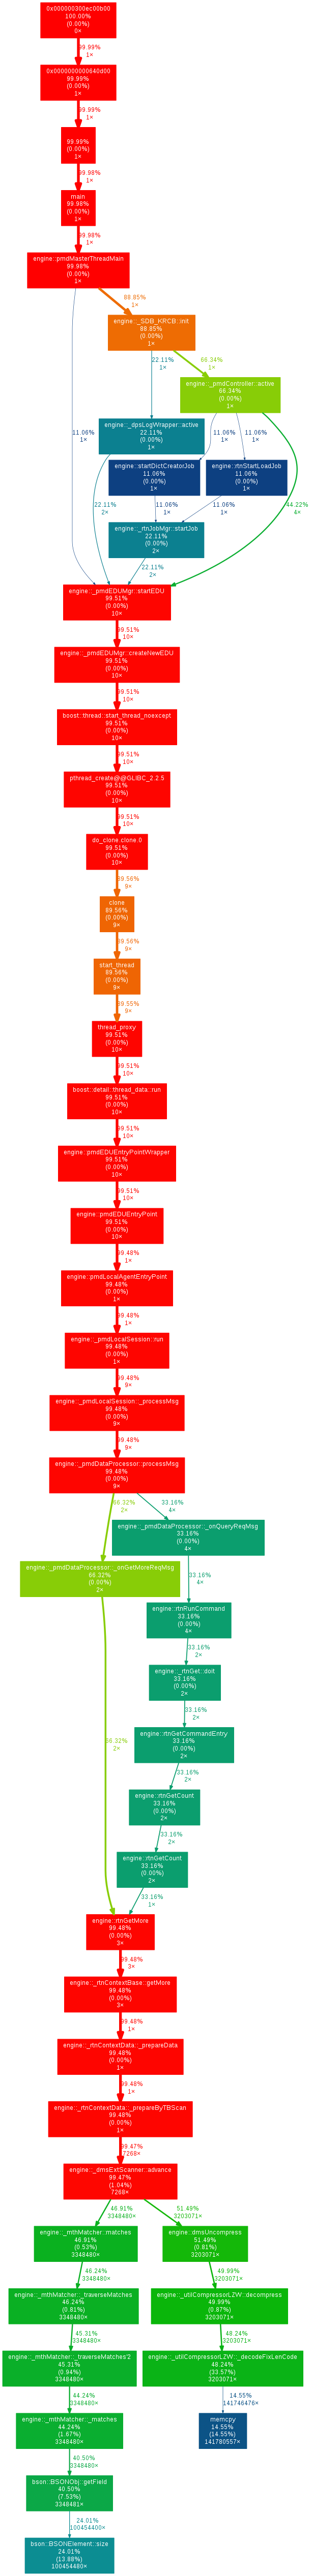
以下就是使用valgrind 对sequoiadb 做了一次全表扫描的监控图,表中包含300多万条记录
当然,如果是希望在图形化街面上看到valgrind 更加详细的监控数据,还是建议大家使用kcachegrind 工具进行查看
在ubuntu上安装kcachegrind 图形化工具,查看callgrind 生成的监控数据
apt-get install kcachegrind
dot 是graphviz 程序里的一个工具,graphviz 下载地址:http://www.graphviz.org/Download_source.php
编译方式
tar zxf graphviz-2.26.3.tar.gz
cd graphviz-2.26.3
./configure --prefix=/usr
make && make install
valgrind 学习文档:
callgrind 输出文件转换教程
如何安装 dot 工具