1、官网下载elasticsearch_exporter的安装包,地址如下:
```bash
https://github.com/prometheus-community/elasticsearch_exporter
```
2、配置成服务
```bash
vim /etc/systemd/system/elasticsearch_exporter.service ###写入如下内容
[Unit]
Description=elasticsearch_exporter
After=syslog.target network.target
[Service]
Type=simple
RemainAfterExit=no
WorkingDirectory=/usr/local/elasticsearch_exporter/
User=root
Group=root
ExecStart=/usr/local/elasticsearch_exporter/elasticsearch_exporter --es.timeout=5s --web.listen-address ":9555" --es.uri http://user:password@172.21.210.49:9200
Restart=always
RestartSec=5
[Install]
WantedBy=multi-user.target
#启动
#配置开机自启,并启动:
systemctl daemon-reload
systemctl enable elasticsearch_exporter
systemctl start elasticsearch_exporter
systemctl status elasticsearch_exporter -l
#查看数据采集
curl http://172.21.210.48:9555/metrics
```
3、prometheus配置
```bash
调整配置文件,与elasticsearch_exporter连接:
vim /usr/local/prometheus/prometheus.yml
- job_name: 'elasticsearch_cluster'
static_configs:
- targets:
- 172.21.210.48:9555
#重载promeitheus
curl -X POST http://127.0.0.1:9090/-/reload
```
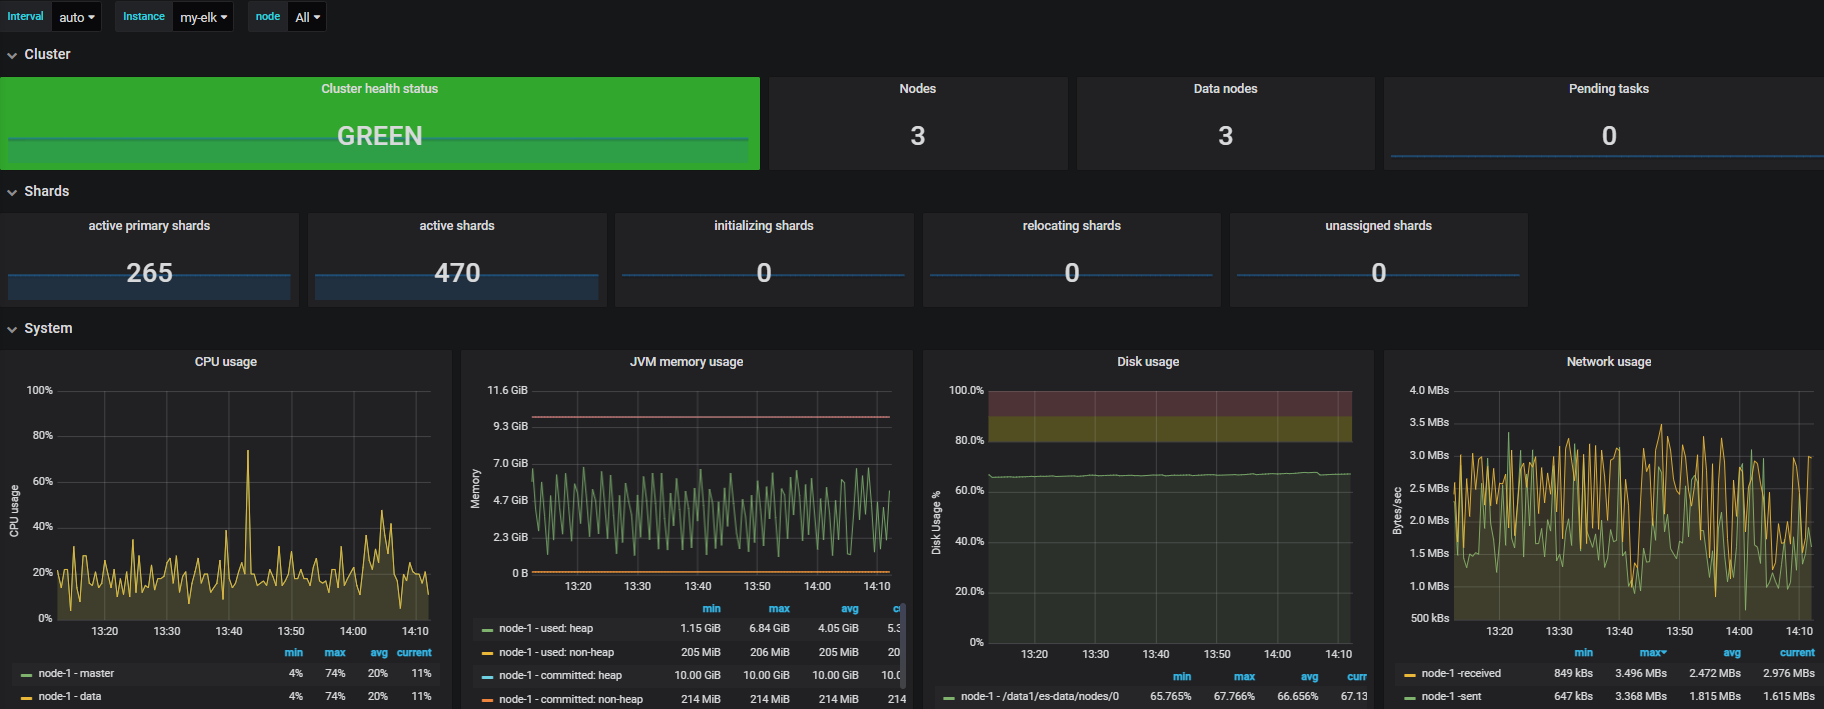
4、grafna进行页面展示
导入模板2322 Grafana Dashboard:https://grafana.com/grafana/dashboards/2322