今日组会分享了一篇有关可视化界面设计的论文,收获颇多,在此记录一下。
论文期刊:IEEE TRANSACTIONS ON VISUALIZATION AND COMPUTER GRAPHICS, VOL. 29, NO. 1, JANUARy 2023
What is Dashboard (可视化界面)?
“Dashboard : A visual display of the most important information needed to achieve one or more objectives; consolidated and arranged on a single screen so that the information can be monitored at a glance”

Dashboard Design Patterns
In this paper, They analyze the visual design of 144 dashboards. Their final coding describes 42 design pattern that describe common solutions to design decisions. They group the patterns into two high-level groups.
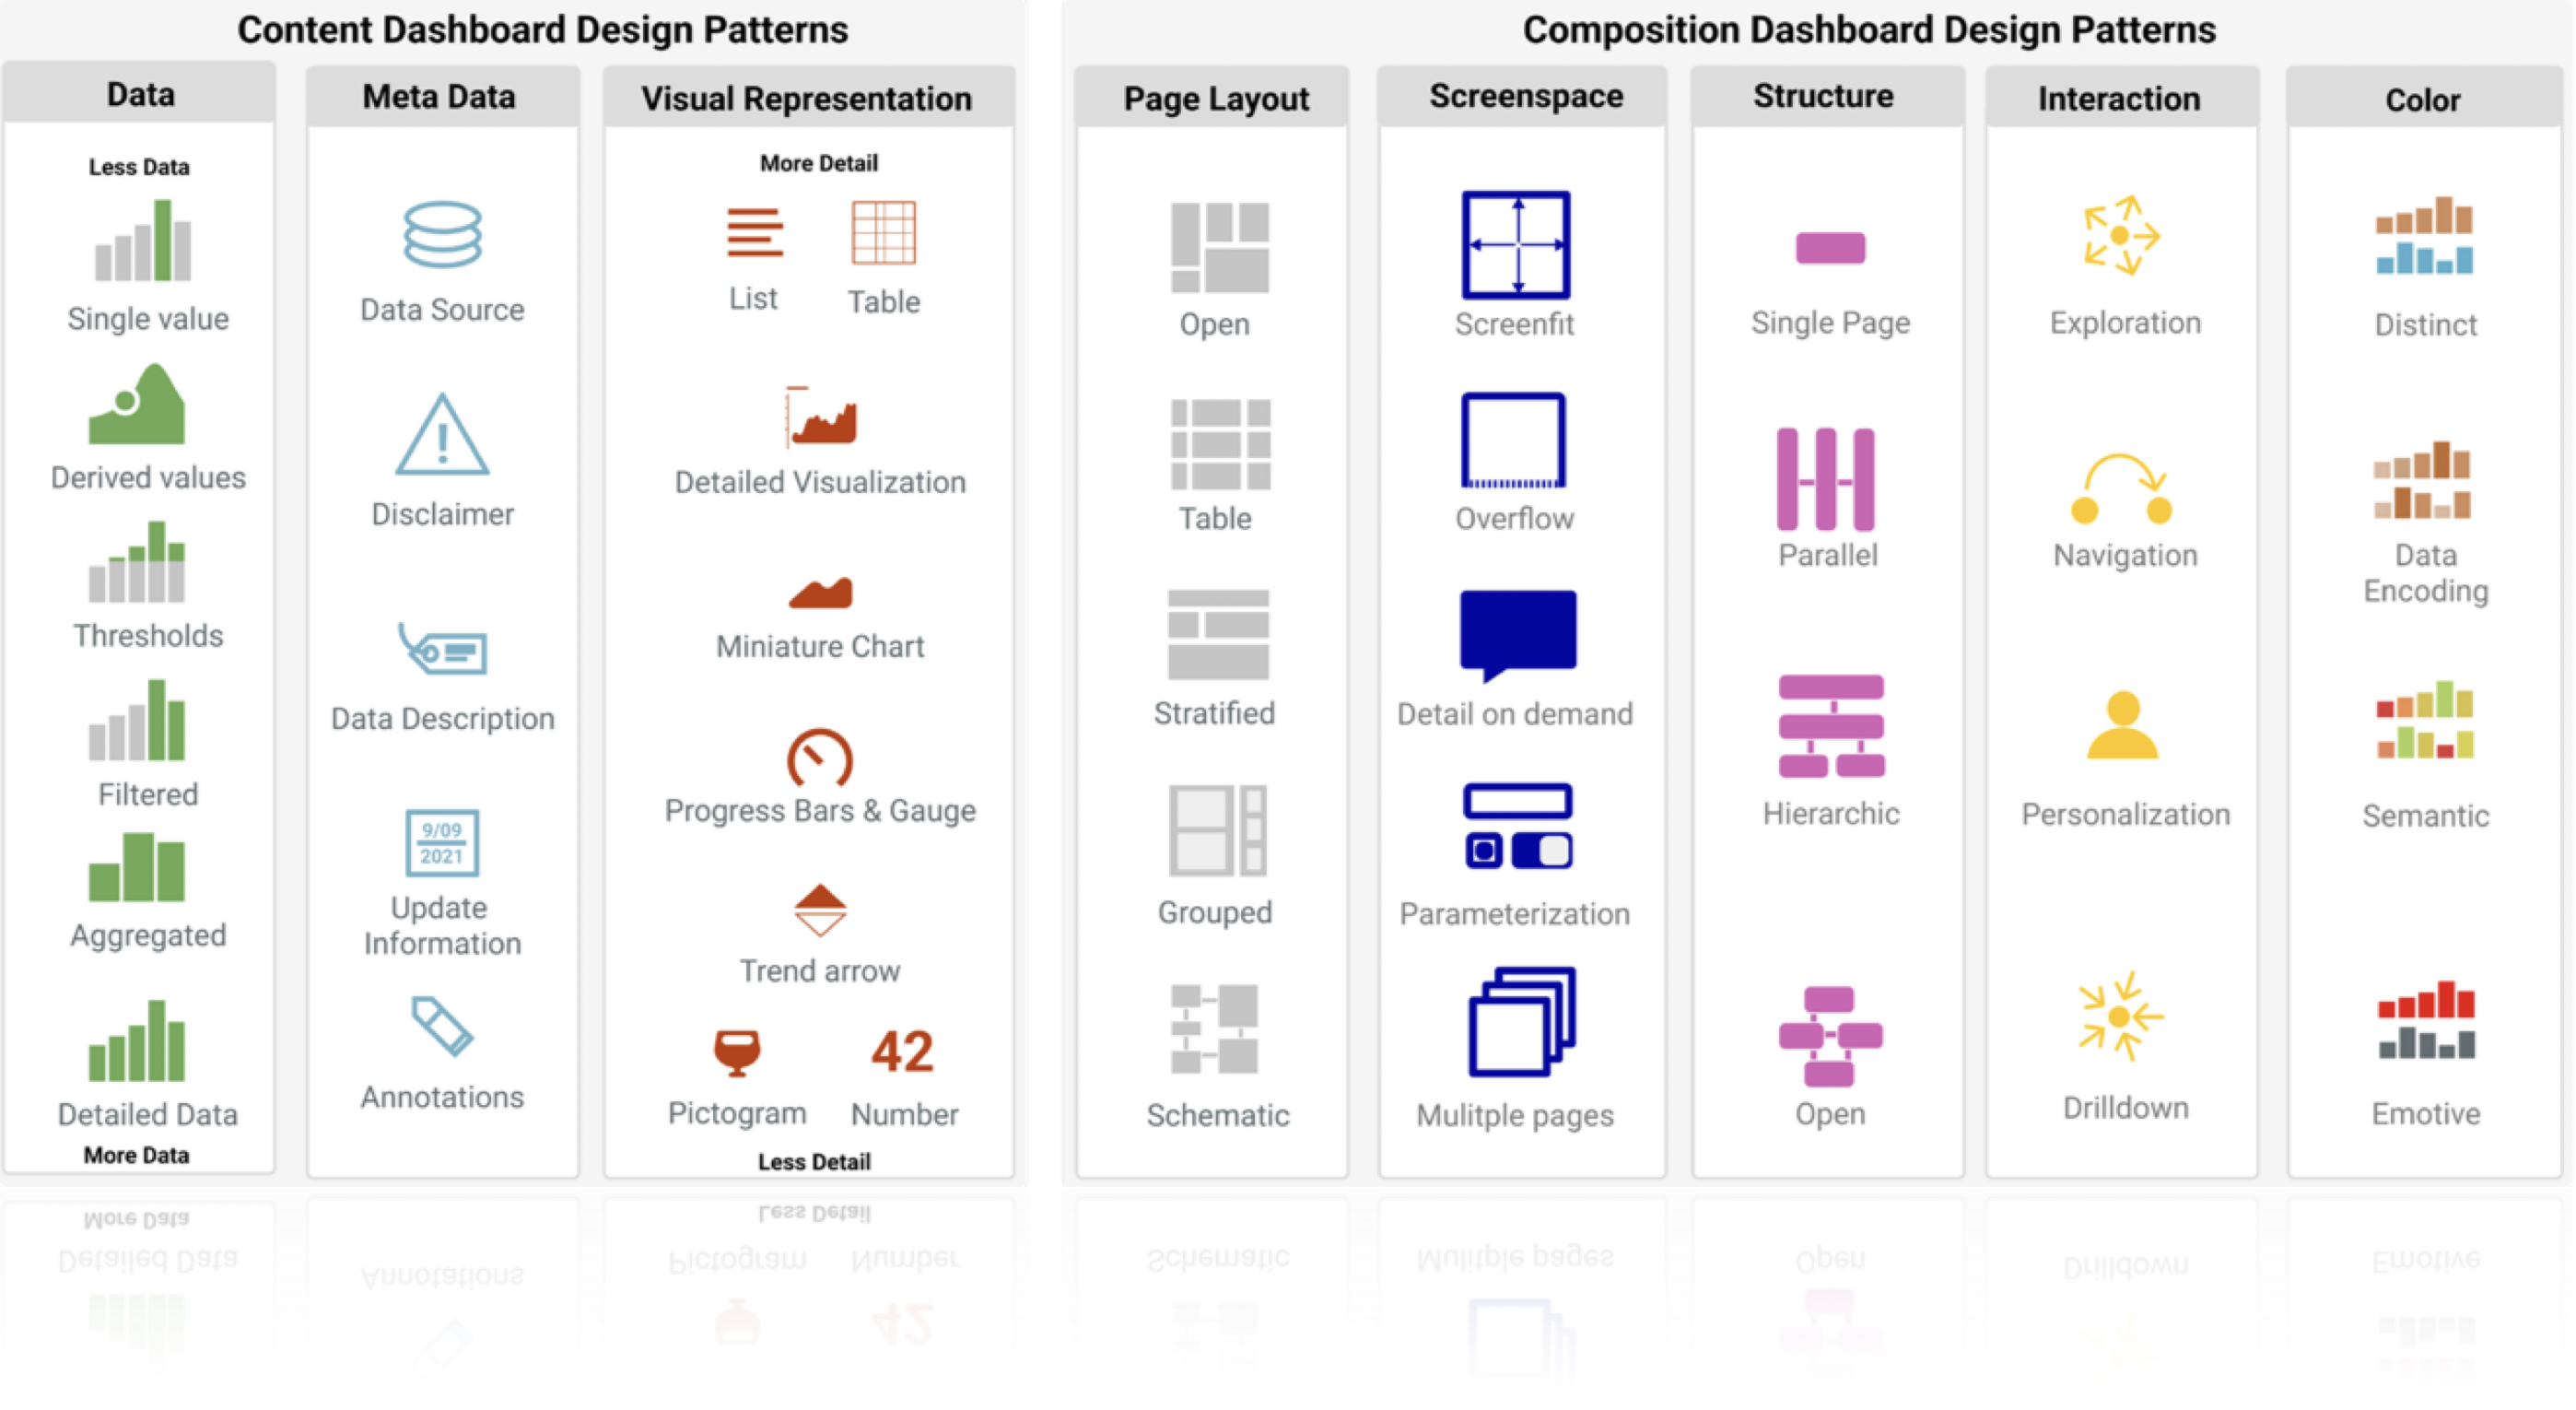
1、Content Design Patterns
“how the data are abstracted (Data Information), what Meta Information is included, and what Visual Representations are used.”
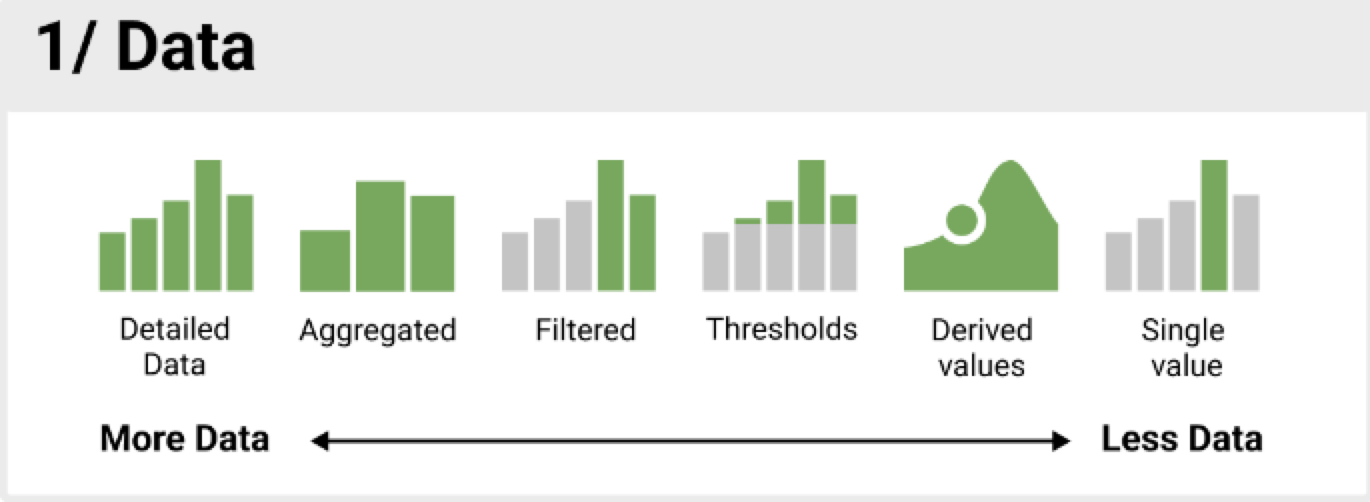
Data: This group identifies the types of information presented and the extent of abstraction used. e.g., Thresholds indicate states and values that bear some meaning, such as ‘good’ or ‘bad’.

Meta Data: This group capture additional information used to provide context and explanation. e.g., the current date, or data released by a specific organization.
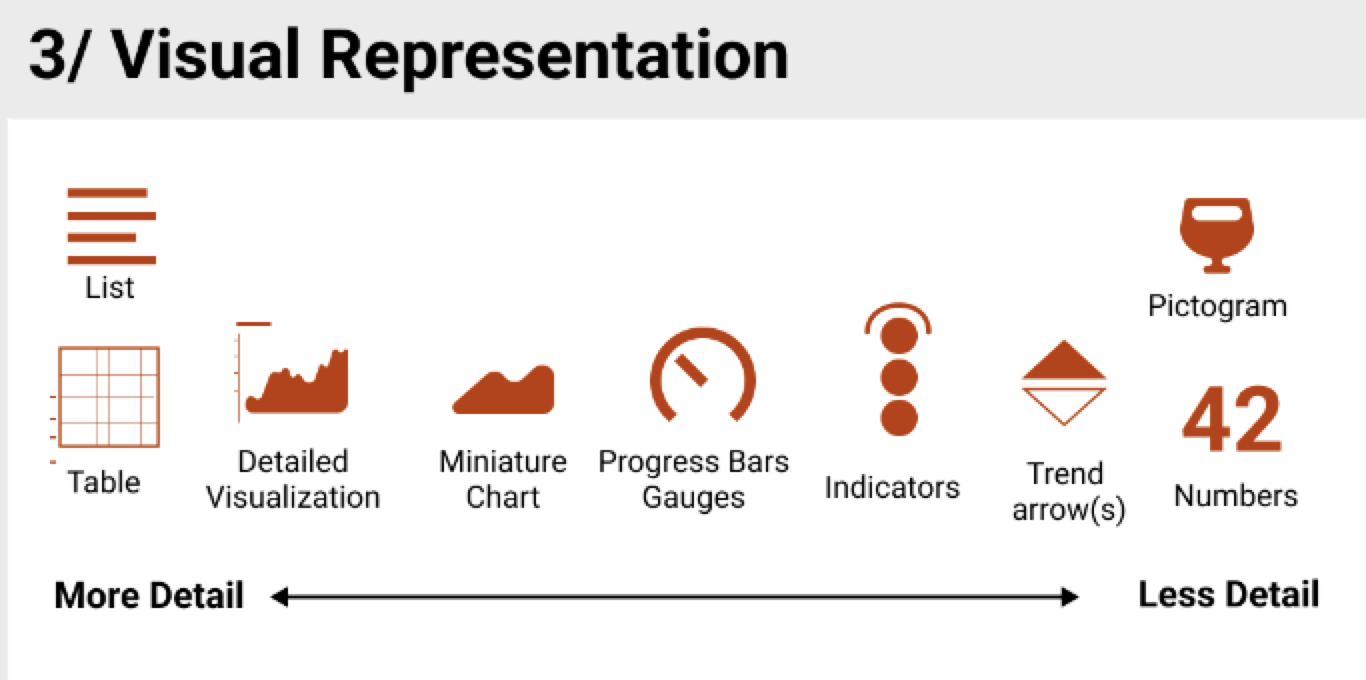
Visual Representation: This group describes common solutions for presenting data information in dashboards. e.g., Pictograms abstract representations or symbols that illustrate concepts in the data.
2、Composition Design Patterns
“the Page Layout of components, solutions to fit information into available Screenspace, the Structure of information across pages, what Interactions are supported, and the purposeful use of Color”
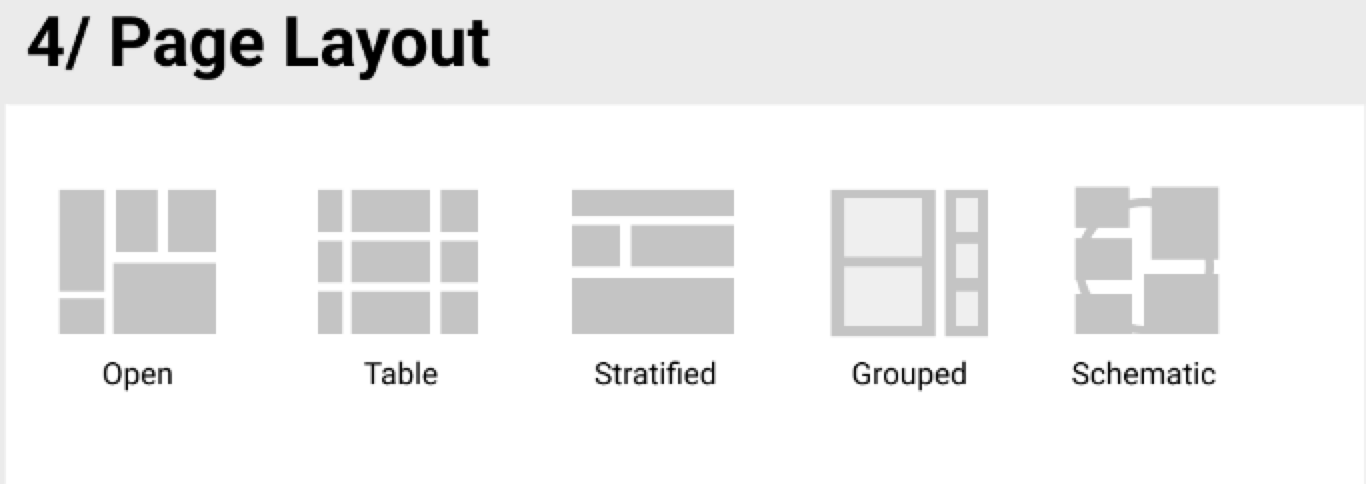
Page Layout: This group describe how the smallest unit on screen are laid out and, often, implicitly grouped in a dashboard. e.g., A Stratified Layouts emphasize a top-down ordering of widgets and their information.
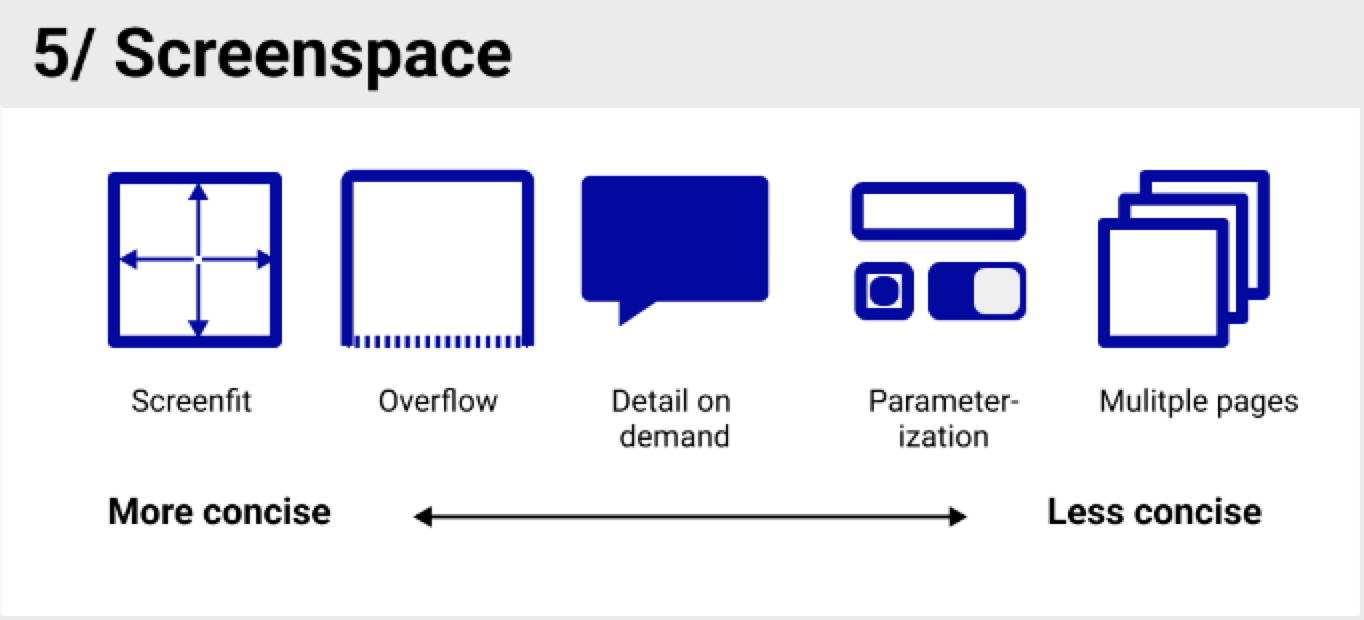
Screenspace: This group describe solutions used to fit content onto a single screen. e.g., Parameterized allow users to control what content is currently shown on screen.

Structure: This group describe how a dashboard organizes information across multiple pages, and the implied relationships between those pages. e.g., Single Pagepresents all information on one page
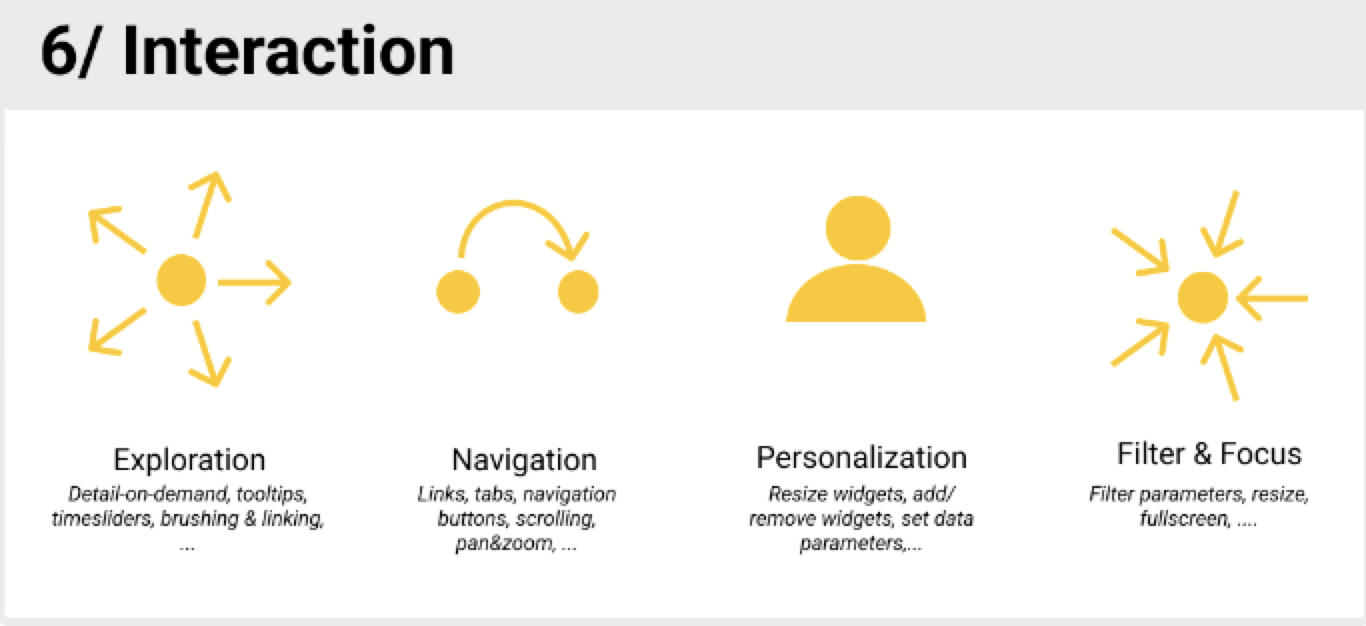
Interaction: This group describes common interaction approaches found within dashboards. e.g., Filter and Focus interactions allow users to find or focus on specific data.

Color: Color is an important visual variable in visualization and can be used for different purposes in dashboard design as well. e.g., Semantic color use to indicate specific semantics like traffic light schemes, green/red for positive/negative sentiment.
Design Tradeoffs
How much interaction do we include in a dashboard?
How much information to include in a single page?
How to personalize a dashboard?...?
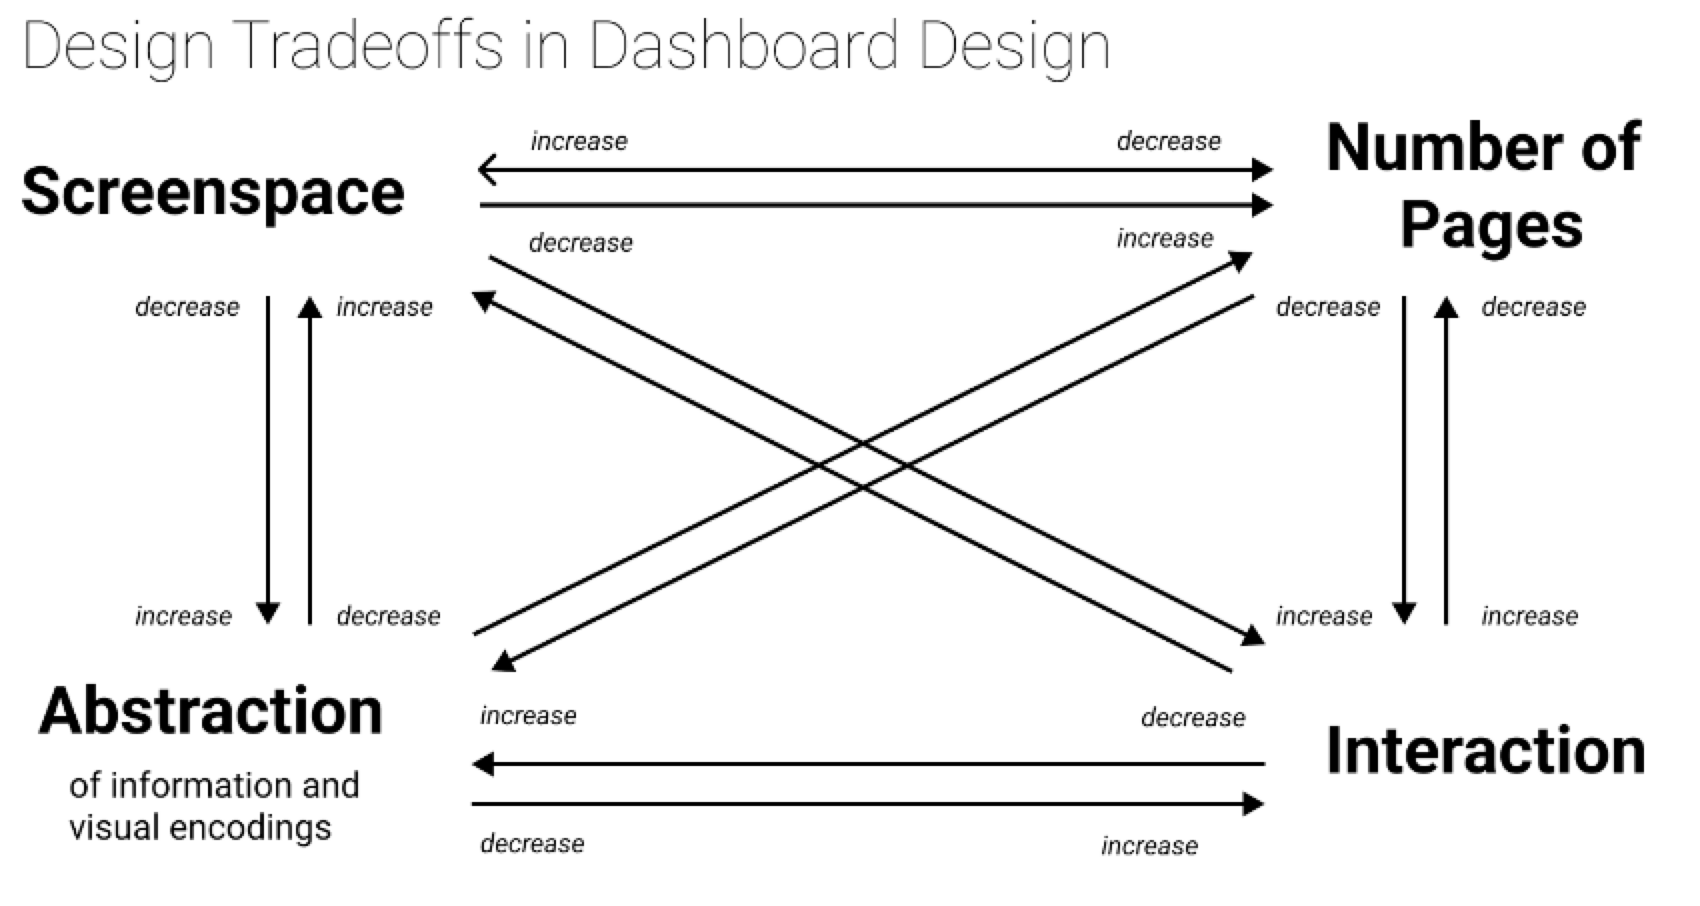
Minimizing one parameter, requires increasing one or more of the other parameters. e.g., reducing Screenspace by increasing interactivity.
Design Process and Guidelines
Stage 0: Clarify the context
What is your audience?
What is the setting in which they engage with the dashboard?
What are the tasks and decisions your audience wants to perform?
Stage 1: Data & Information
At this stage, you want to clarify which information from the dataset is important for the user in a given task (see Stage 0). The design patterns give you some ideas what information and how much information you want to provide about your dataset.
Stage 2: Structure
At this stage, you should think about the overall structure of your information and whether you can display everything a single page (or screen), or whether you need multiple pages to show all the information you identified in stage 1(data & information).
Stage 3: Visual Representations
At this stage you want to find visual representations for your data and information (for each page). Similar to data, these visual representations can show more detail and using more screenspace, or they can be more concise and using less screenspace
Stage 4: Page Layout
At this stage, you develop a layout of your page. You need to organize the individual components and visual representations into a meaningful structure.
Stage 5: Screenspace
At this stage you need to decide how to deal with your screen space. You have several options to try to fit everything into a single screen, or find ways to interactively show data you cannot fit onto a static screen.
Stage 6: Interactivity
At this stage you will think about the specific interaction components you need to support exploration focus & filter navitation Personalization