import pandas as pd
import matplotlib.pyplot as plt

reviews = pd.read_csv('fandango_scores.csv') # 电影评分的数据集,包含了电影名称和不同对象的评分

cols = ['FILM','RT_user_norm','Metacritic_user_nom','IMDB_norm','Fandango_Ratingvalue','Fandango_Stars']

norm_reviews = reviews[cols]
print(norm_reviews[:5])
                             FILM  RT_user_norm  Metacritic_user_nom  \
0  Avengers: Age of Ultron (2015)           4.3                 3.55
1               Cinderella (2015)           4.0                 3.75
2                  Ant-Man (2015)           4.5                 4.05
3          Do You Believe? (2015)           4.2                 2.35
4   Hot Tub Time Machine 2 (2015)           1.4                 1.70

   IMDB_norm  Fandango_Ratingvalue  Fandango_Stars
0       3.90                   4.5             5.0
1       3.55                   4.5             5.0
2       3.90                   4.5             5.0
3       2.70                   4.5             5.0
4       2.55                   3.0             3.5
# 计算'IMDB_norm'的值计数并按索引排序
imdb_distribution = norm_reviews['IMDB_norm'].value_counts().sort_index()
print(imdb_distribution)
2.00     1
2.10     1
2.15     1
2.20     1
2.30     2
2.45     2
2.50     1
2.55     1
2.60     2
2.70     4
2.75     5
2.80     2
2.85     1
2.90     1
2.95     3
3.00     2
3.05     4
3.10     1
3.15     9
3.20     6
3.25     4
3.30     9
3.35     7
3.40     1
3.45     7
3.50     4
3.55     7
3.60    10
3.65     5
3.70     8
3.75     6
3.80     3
3.85     4
3.90     9
3.95     2
4.00     1
4.05     1
4.10     4
4.15     1
4.20     2
4.30     1
Name: IMDB_norm, dtype: int64
# 计算'Fandango_Ratingvalue'的值计数并按索引排序
fandango_distribution = norm_reviews['Fandango_Ratingvalue'].value_counts().sort_index()
print(fandango_distribution)
2.7     2
2.8     2
2.9     5
3.0     4
3.1     3
3.2     5
3.3     4
3.4     9
3.5     9
3.6     8
3.7     9
3.8     5
3.9    12
4.0     7
4.1    16
4.2    12
4.3    11
4.4     7
4.5     9
4.6     4
4.8     3
Name: Fandango_Ratingvalue, dtype: int64
fig,ax = plt.subplots()
# ax.hist(norm_reviews['Fandango_Ratingvalue'])
# ax.hist(norm_reviews['Fandango_Ratingvalue'],bins=20)

# 分为20个 bin,并且数据范围限定在4到5之间
ax.hist(norm_reviews['Fandango_Ratingvalue'],bins=20,range=(4,5))

plt.show()
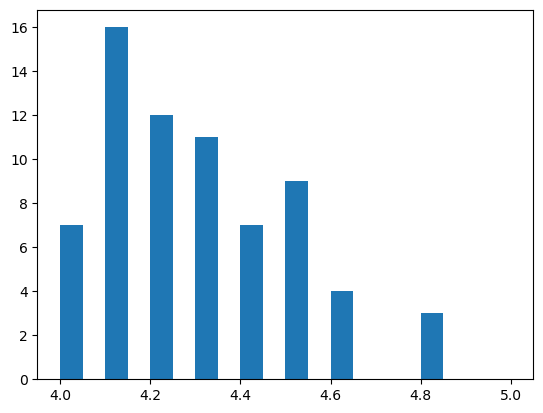
fig = plt.figure(figsize=(10,10))

ax1 = fig.add_subplot(2,2,1)
ax1.hist(norm_reviews['Fandango_Ratingvalue'],bins=20,range=(0,5))
ax1.set_title('Distribution of Fandango_Ratings')
ax1.set_ylim(0,50) # y 轴限制为 0 到 50

ax2 = fig.add_subplot(2,2,2)
ax2.hist(norm_reviews['RT_user_norm'],bins=20,range=(0,5))
ax2.set_title('Distribution of Rotten Tomatoes Ratings')
ax2.set_ylim(0,50) # y 轴限制为 0 到 50

ax3 = fig.add_subplot(2,2,3)
ax3.hist(norm_reviews['Metacritic_user_nom'],bins=20,range=(0,5))
ax3.set_title('Distribution of Metacritic Ratings')
ax3.set_ylim(0,50) # y 轴限制为 0 到 50

ax3 = fig.add_subplot(2,2,4)
ax3.hist(norm_reviews['IMDB_norm'],bins=20,range=(0,5))
ax3.set_title('Distribution of IMDB Ratings')
ax3.set_ylim(0,50) # y 轴限制为 0 到 50

plt.show()

# 绘制一个箱线图(boxplot),显示 'RT_user_norm' 列的分布情况。箱线图可以显示数据的分位数、中位数、异常值等统计信息。
flg, ax = plt.subplots()
ax.boxplot(norm_reviews['RT_user_norm'])
ax.set_xticklabels(['RT_user_norm'])
ax.set_ylim(0,5)

plt.show()
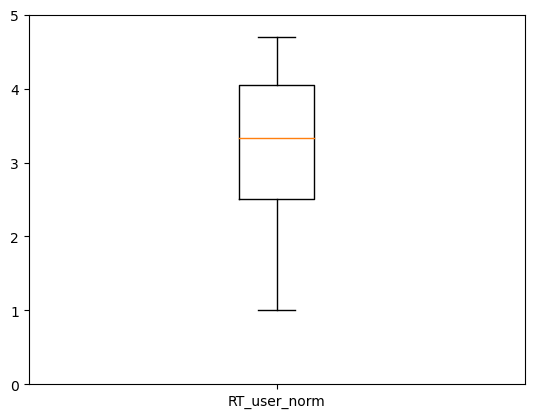
箱线图解释
中位数(Q2或第二四分位数):箱线图中的中线代表数据的中位数,即将数据排序后位于中间位置的值。(图中黄色)
异常值:箱线图中显示的异常值是指相对于箱体的“离群点”,即远离四分位数的数据点,可以是异常值或者极端值。
四分位数:
- 第一四分位数(Q1):将数据分成四等份,第一四分位数是数据的最低 25%。(下方)
- 第三四分位数(Q3):是数据的最低 75% 。(上方)