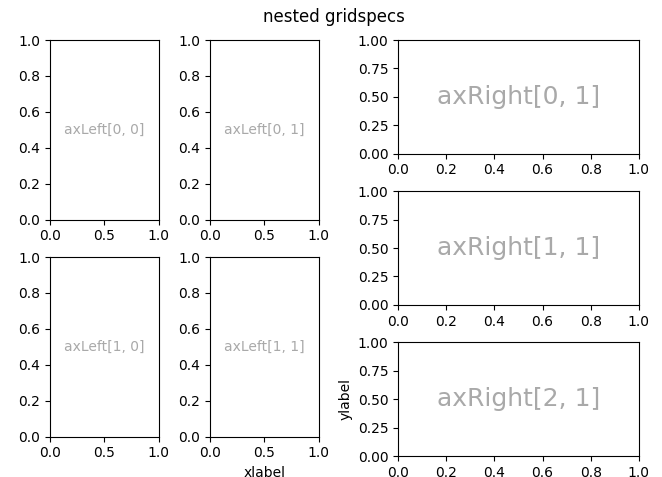
从high-level方法和low-level方法讲figure上的axes布局。
从high-level的角度,我们可以用以下几种方法,直接设置布局:
import matplotlib.pylot as plt
# 创建2x2的布局

# 方法1:
fig, axes = plt.subplots(nrows=2, ncols=2)

# 方法2:
fig, axes = plt.subplot_mosaic([['upper left', 'upper right'],  ['lower left', 'lower right']])
从low-level的角度来看,figure的布局由两个特性决定:
- GridSpec
明确figure上的网格(grid)形状,而所有之后的绘图(subplot)都是在网格形状上进行布局。 - SubplotSpec
确定subplot的定位。
基本2x2布局
high-level
import matplotlib.pylot as plt
# 创建2x2的布局

# 方法1:
fig, axs = plt.subplots(ncols=2, nrows=2, figsize=(5.5, 3.5),
                        layout="constrained")

# 方法2:
fig, axd = plt.subplot_mosaic([['upper left', 'upper right'],
                               ['lower left', 'lower right']],
                              figsize=(5.5, 3.5), layout="constrained")
low-level
fig = plt.figure(figsize=(5.5, 3.5), layout="constrained")
spec = fig.add_gridspec(ncols=2, nrows=2)

ax0 = fig.add_subplot(spec[0, 0])
ax1 = fig.add_subplot(spec[0, 1])
ax2 = fig.add_subplot(spec[1, 0])
ax3 = fig.add_subplot(spec[1, 1])
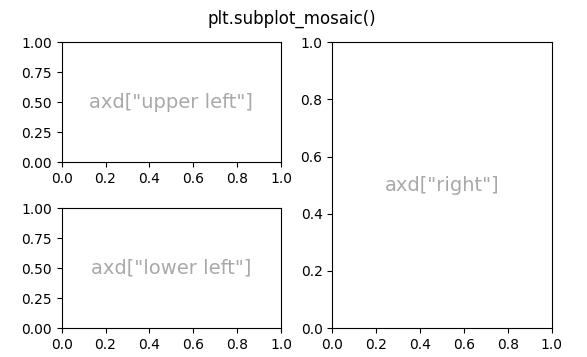
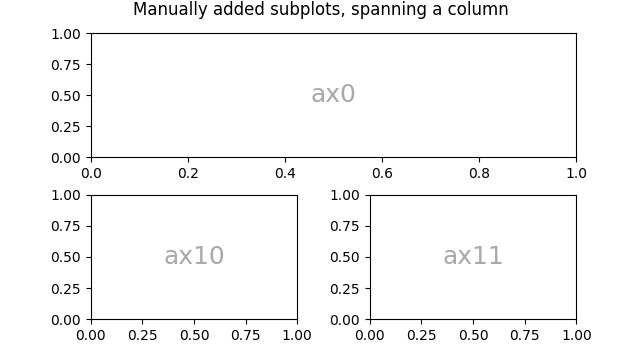
axes在行或列方向拓展
high-level
fig, axd = plt.subplot_mosaic([['upper left', 'right'],
                               ['lower left', 'right']],
                              figsize=(5.5, 3.5), layout="constrained")
low-level
fig = plt.figure(figsize=(5.5, 3.5), layout="constrained")
spec = fig.add_gridspec(2, 2)

ax0 = fig.add_subplot(spec[0, :])
ax10 = fig.add_subplot(spec[1, 0])
ax11 = fig.add_subplot(spec[1, 1])
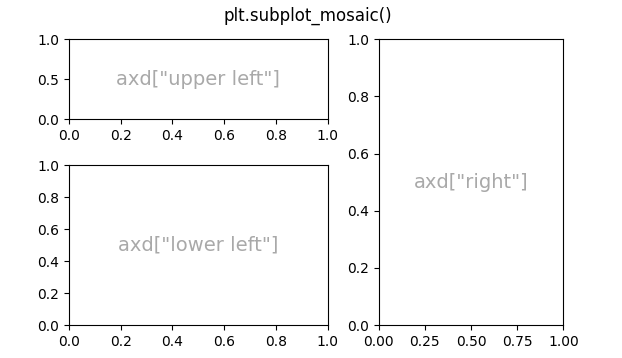
调整axes的宽和高比例
high-level
通过指定width_ratio和height_ratio参数,或者指定gridspec_kw参数
gs_kw = dict(width_ratios=[1.4, 1], height_ratios=[1, 2])
fig, axd = plt.subplot_mosaic([['upper left', 'right'],
                               ['lower left', 'right']],
                              gridspec_kw=gs_kw, figsize=(5.5, 3.5),
                              layout="constrained")
low-level
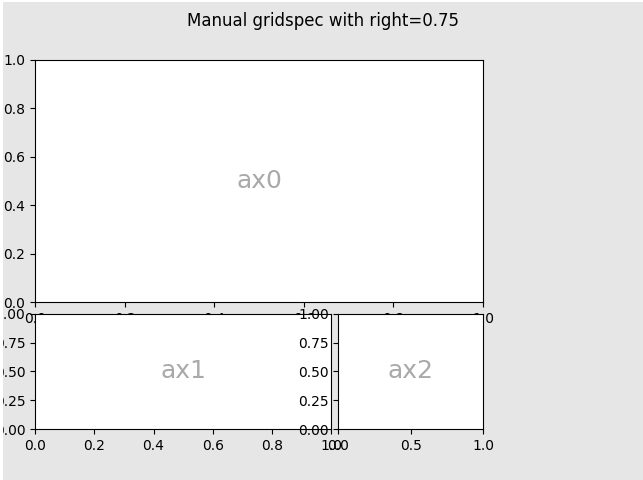
fig = plt.figure(layout=None, facecolor='0.9')
# add_gridspec()left和right指定在figure上绘图的左右范围,wspace和hspace指定axes之间上下左右间距
gs = fig.add_gridspec(nrows=3, ncols=3, left=0.05, right=0.75,
                      hspace=0.1, wspace=0.05)

ax0 = fig.add_subplot(gs[:-1, :])
ax1 = fig.add_subplot(gs[-1, :-1])
ax2 = fig.add_subplot(gs[-1, -1])
在同一figure上设置多个axes grid
high-level
#利用subfigure方法
fig = plt.figure(layout="constrained")
subfigs = fig.subfigures(1, 2, wspace=0.07, width_ratios=[1.5, 1.])
axs0 = subfigs[0].subplots(2, 2)
axs1 = subfigs[1].subplots(3, 1)

low-level
# 利用add_subgidspec方法
fig = plt.figure(layout="constrained")
gs0 = fig.add_gridspec(1, 2)

gs00 = gs0[0].subgridspec(2, 2)
gs01 = gs0[1].subgridspec(3, 1)
