Acquiring Heap Dumps
HPROF Binary Heap Dumps
Get Heap Dump on an OutOfMemoryError
One can get a HPROF binary heap dump on an OutOfMemoryError for Sun JVM (1.4.2_12 or higher and 1.5.0_07 or higher), Oracle JVMs, OpenJDK JVMs, HP-UX JVM (1.4.2_11 or higher) and SAP JVM (since 1.5.0) by setting the following JVM parameter:
-XX:+HeapDumpOnOutOfMemoryError
The heap dump is written to the work directory.
Interactively Trigger a Heap Dump
To get heap dump on demand one can add the following parameter to the JVM and press CTRL + BREAK in the preferred moment:
-XX:+HeapDumpOnCtrlBreak
HPROF agent
To use the HPROF agent to generate a dump on the end of execution, or on SIGQUIT signal use the following JVM parameter:
-agentlib:hprof=heap=dump,format=b
Alternatively, other tools can be used to acquire a heap dump:
- jmap -dump:format=b,file=<filename.hprof> <pid>
- JConsole (see sample usage in Basic Tutorial)
- Memory Analyzer (see bottom of page)
System Dumps and Heap Dumps from IBM Virtual Machines
- All known formats
- HPROF binary heap dumps
- IBM 1.4.2 SDFF1
- IBM Javadumps
- IBM SDK for Java (J9) system dumps
- IBM SDK for Java Portable Heap Dumps
For a comparison of dump types, see Debugging from dumps. System dumps are simply operating system core dumps; therefore, they are a superset of portable heap dumps. System dumps are far superior than PHDs, particularly for more accurate GC roots, thread-based analysis, and unlike PHDs, system dumps contain memory contents like HPROFs.
Older versions of IBM Java (e.g. < 5.0SR12, < 6.0SR9) require running jextract on the operating system core dump which produced a zip file that contained the core dump, XML or SDFF file, and shared libraries. The IBM DTFJ feature still supports reading these jextracted zips although IBM DTFJ feature version 1.12.29003.201808011034 and later cannot read IBM Java 1.4.2 SDFF files, so MAT cannot read them either. Dumps from newer versions of IBM Java do not require jextract for use in MAT since DTFJ is able to directly read each supported operating system's core dump format. Simply ensure that the operating system core dump file ends with the .dmp suffix for visibility in the MAT Open Heap Dump selection. It is also common to zip core dumps because they are so large and compress very well. If a core dump is compressed with .zip, the IBM DTFJ feature in MAT is able to decompress the ZIP file and read the core from inside (just like a jextracted zip). The only significant downsides to system dumps over PHDs is that they are much larger, they usually take longer to produce, they may be useless if they are manually taken in the middle of an exclusive event that manipulates the underlying Java heap such as a garbage collection, and they sometimes require operating system configuration ( Linux, AIX) to ensure non-truncation.
-Xdump:system:events=systhrow,filter=java/lang/OutOfMemoryError,request=exclusive+prepwalk -Xdump:heap:none
In addition to an OutOfMemoryError, system dumps may be produced using operating system tools (e.g. gcore in gdb for Linux, gencore for AIX, Task Manager for Windows, SVCDUMP for z/OS, etc.), using the IBM Java APIs, using the various options of -Xdump, using Java Surgery, and more.
Versions of IBM Java older than IBM JDK 1.4.2 SR12, 5.0 SR8a and 6.0 SR2 are known to produce inaccurate GC root information.
Acquire Heap Dump from Memory Analyzer
If the Java process from which the heap dump is to be acquired is on the same machine as the Memory Analyzer, it is possible to acquire a heap dump directly from the Memory Analyzer. Dumps acquired this way are directly parsed and opened in the tool.
Acquiring the heap dump is VM specific. Memory Analyzer comes with several so called heap dump providers - for Oracle and Sun based VMs (needs a Oracle or Sun JDK with jmap) and for IBM VMs (needs an IBM JDK or JRE). Also extension points are provided for adopters to plug-in their own heap dump providers.
To trigger a heap dump from Memory Analyzer open the
Depending on the concrete execution environment the pre-installed heap dump providers may work with their default settings and in this case a list of running Java processes should appear: To make selection easier, the order of the Java processes can be altered by clicking on the column titles for pid or Heap Dump Provider.
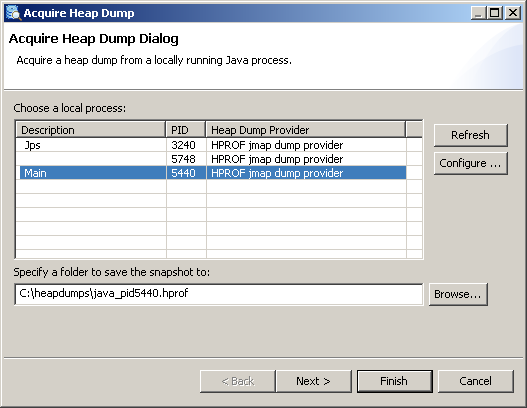

One can now select from which process a heap dump should be acquired, provide a preferred location for the heap dump and press Finish to acquire the dump. Some of the heap dump providers may allow (or require) additional parameters (e.g. type of the heap dump) to be set. This can be done by using
Configuring the Heap Dump Providers
If the process list is empty try to configure the available heap dump providers. To do this press Configure... , select a matching provider from the list and click on it. You can see then what are the required settings and specify them.
If a process is selected before pressing Configure... then the corresponding dump provider will be selected on entering the Configure Heap Dump Providers... page.
- HPROF jmp dump provider
- This provider uses the jps command supplied with an Oracle or OpenJDK based JDK to list the running JVMs on the system. The provider then uses the jmap command to get the chosen JVM to generate an HPROF dump. This provider requires a JDK (Java development kit), not a JRE (Java runtime environment) for those two commands. IBM JDKs do not have the jps or jmap commands. The commands on an OpenJ9 JDK may not work well enough for this provider to work with those JVMs.
- Attach API
- This uses the com.sun.tools.attach or com.ibm.tools.attach APIs to list the JVMs and then to attach to the chosen JVM to generate a dump. The Attach API is supplied as part of IBM JDKs and JREs, but is only supplied as part of Oracle or OpenJDK JDKs in tools.jar and not as part of JREs. Therefore if Memory Analyzer is run with an Oracle JRE then this dump provider will not be available. The com.sun.tools.attach API is available on Oracle and OpenJDK JDKs, on OpenJ9 JDKs and JREs and IBM JDKs and JREs version Java 8 SR5 or later. The com.ibm.tools.attach API is available on earlier IBM JDKs and JREs. The Attach API dump provider automatically uses whichever Attach API is available, and loads tools.jar if required. The Attach API with Java 9 or later does not permit a Java process to connect to itself, so MemoryAnalyzer cannot generate a dump of itself using the Attach API dump provider. Use another dump provider instead.
- Attach API with helper JVM
- If Memory Analyzer is run with an Oracle JRE then this dump provider can be used with an Oracle JDK by providing a path to a java executable. The dump provider will load the tools.jar if required. so that the com.sun.tools.attach API is acessible. This provider can also be used to list JVMs of a different type from the JVM used to run Memory Analyzer. For example dumps from IBM JVMs can be generated by specifying a path to an IBM JVM java command even when Memory Analyzer is run with an Oracle JVM.
Options
- Dump Type
- System
- These process core dumps are generated using the com.ibm.jvm.Dump.SystemDump() method called by an agent library generated and loaded into the target JVM by Memory Analyzer. These dumps can be generated by IBM and OpenJ9 JVMs.
- Heap
- These Portable Heap Dumps are generated using the com.ibm.jvm.Dump.HeapDump() method called by an agent library generated and loaded into the target JVM by Memory Analyzer. These dumps can be generated by IBM and OpenJ9 JVMs.
- Java
- These Javacore dumps are generated using the com.ibm.jvm.Dump.JavaDump() method called by an agent library generated and loaded into the target JVM by Memory Analyzer. These dumps can be generated by IBM and OpenJ9 JVMs.
- HPROF
- These HPROF dumps are generated using the com.sun.management:type=HotSpotDiagnostic MXBean called in an agent library generated and loaded into the target JVM by Memory Analyzer. These dumps can be generated by Oracle and OpenJDK JVMs.
- Other options
- compress
-
System dumps can be processed using jextract which compressed the dump and also adds extra system information so that the dump could be moved to another machine.
Portable Heap Dump (PHD) files generated with the Heap option can be compressed using the gzip compressor to reduce the file size.
HPROF files can be compressed using the Gzip compressor to reduce the file size. A compressed file may take longer to parse in Memory Analyzer, and running queries and reports and reading fields from objects may take longer.
- live
- On IBM JVMs this forces a garbage collection before a dump is taken. This could affect the performance of the program running on the target JVM, but may reduce the size of PHD Heap dumps. On Oracle and OpenJDK JVMs this dumps only live objects into the HPROF file and should reduce its size. By default, Memory Analyzer removes the non-live objects from the dump as it indexes the dump and builds the snapshot, and puts information about those objects in the unreachable objects histogram. If this histogram is used or the 'keep unreachable objects' option is set then the live option should not be set as it will remove required information.
- listattach
- This is used when listing JVMs using the Attach API. The dump provider then attaches to each running JVM in the list and extracts more information to give a better description. This can take a little longer, so if the list operation is cancelled then this option is disabled so the next listing will be faster. The option can be reenabled if required.
- dumpdir
- IBM JVMs produce dumps in a directory specified by the target JVM, not by Memory Analyzer. Memory Analyzer needs to find the dump it caused to be generated, and looks in the target JVM user.dir for the dump files. If this is not the right place then Memory Analyzer will not find the generated dump, so the user would have to find it manually afterwards. If the user knows where the target JVM will produce dumps then it can be entered using this option.
- dumptemplate
- This gives an example file name to be used for the dump. The time and date is inserted into the name using substitution variable 0, for example {0,date,yyyyMMdd.HHmmss} . The process identifier is inserted using substitution variable 1, for example {1,number,0} . The instance number, used to make the dump file unique, is inserted using substitution variable 2, for example {2,number,0000} . The extra 0000 is a standard MessageFormat modifier giving the minimum number of digits to use.
Multiple snapshots in one heap dump
-agentlib:hprof=heap=dump,format=bthen if a heap dump is triggered multiple times all the heap dumps will be written to one file. An IBM z/OS system dump can contain data from multiple address spaces and processes. It is therefore possible that the dump file contains heap dump snapshots from multiple Java runtimes.
Memory Analyzer 1.2 and earlier handled this situation by choosing the first heap dump snapshot found unless another was selected via an environment variable or MAT DTFJ configuration option.
Memory Analyzer 1.3 handles this situation by detecting the multiple dumps, then presenting a dialog for the user to select the required snapshot.
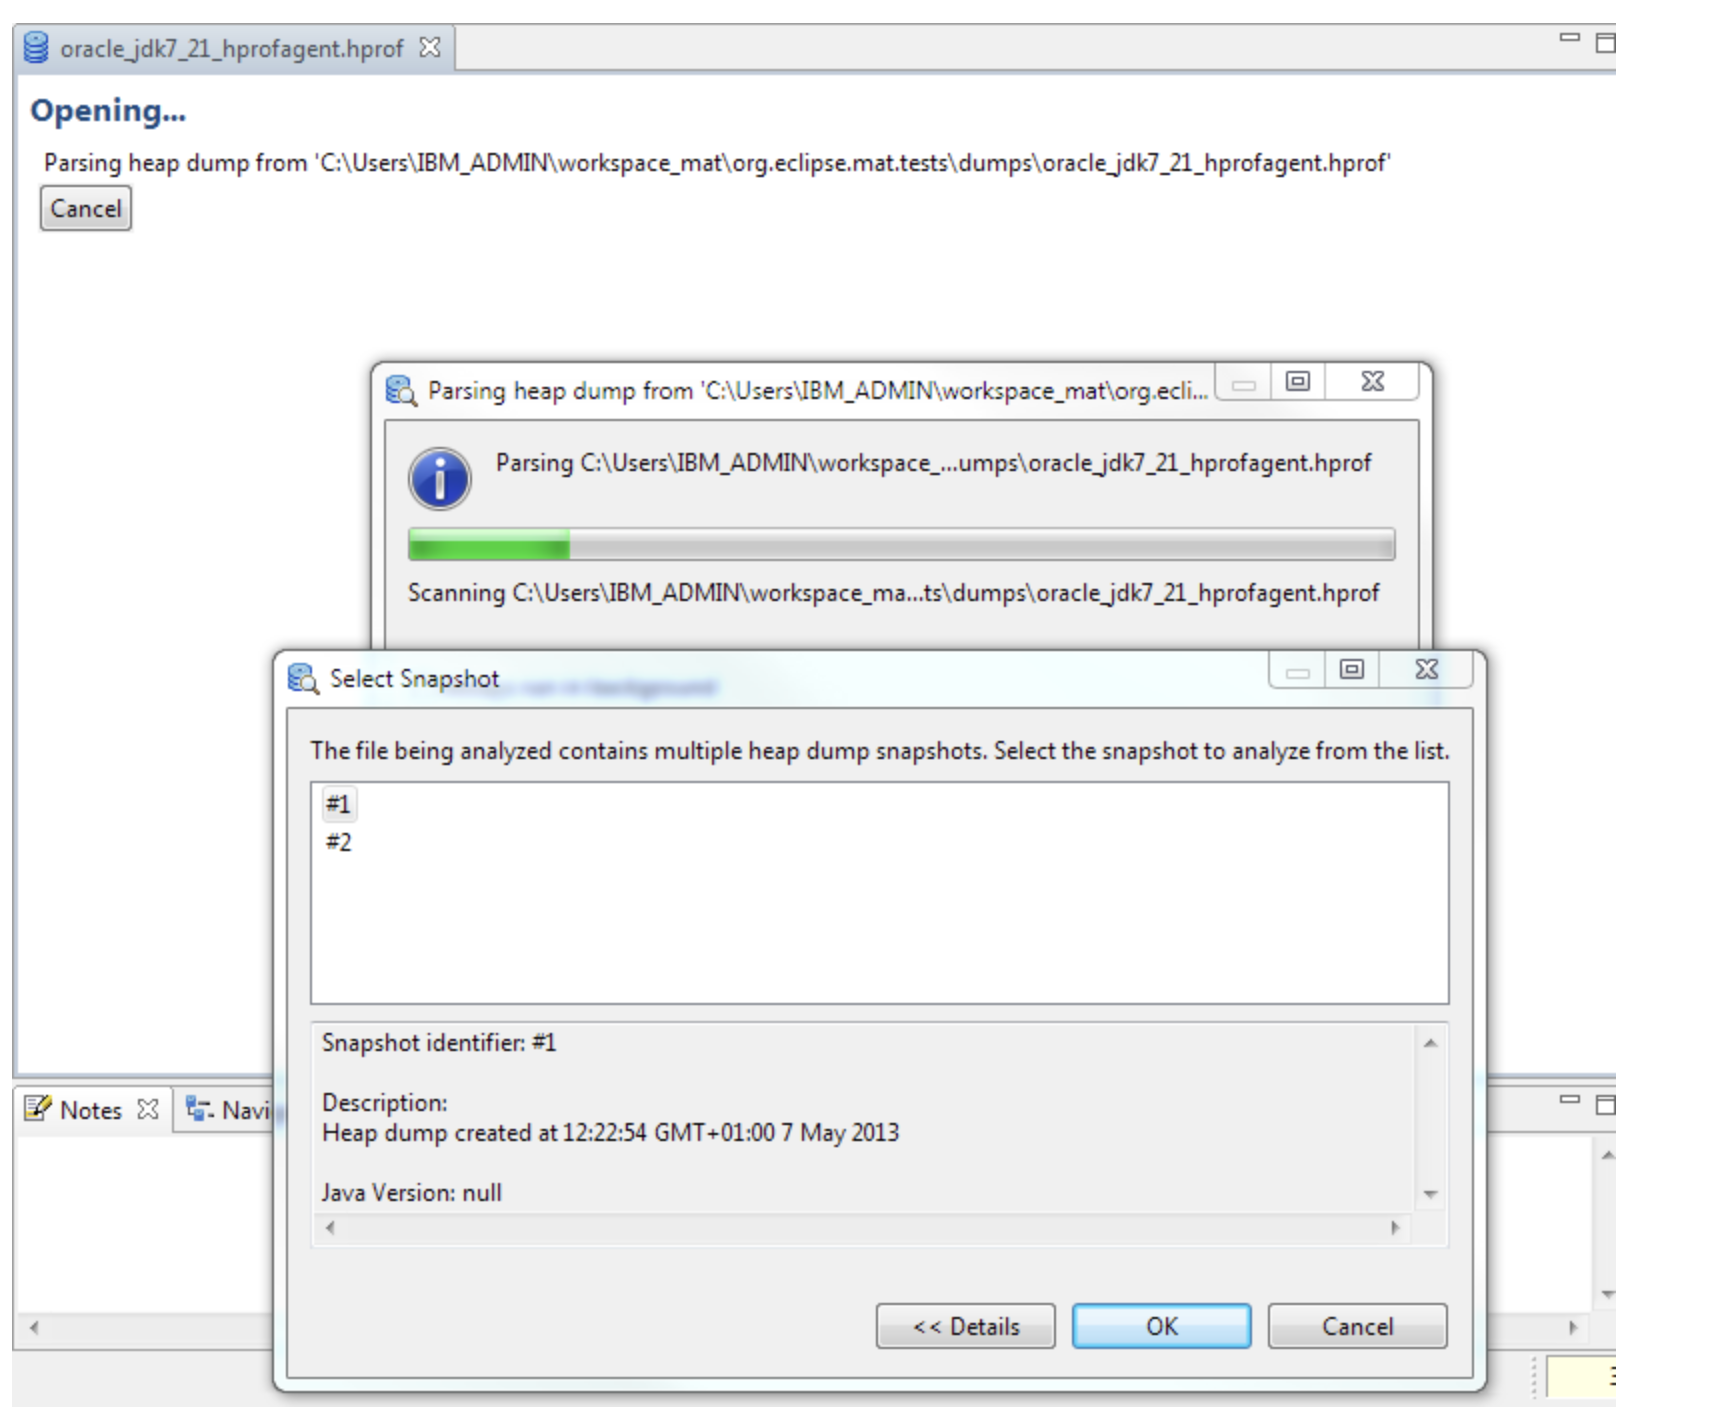

The index files generated have a component in the file name from the snapshot identifier, so the index files from each snapshot can be distinguished. This means that multiple snapshots from one heap dump file can be examined in Memory Analyzer simultaneously. The heap dump history for the file remembers the last snapshot selected for that file, though when the snapshot is reopened via the history the index file is also shown in the history. To open another snapshot in the dump, close the first snapshot, then reopen the heap dump file using the File menu and another snapshot can be chosen to be parsed. The first snapshot can then be reopened using the index file in the history, and both snapshots can be viewed at once.
Summary
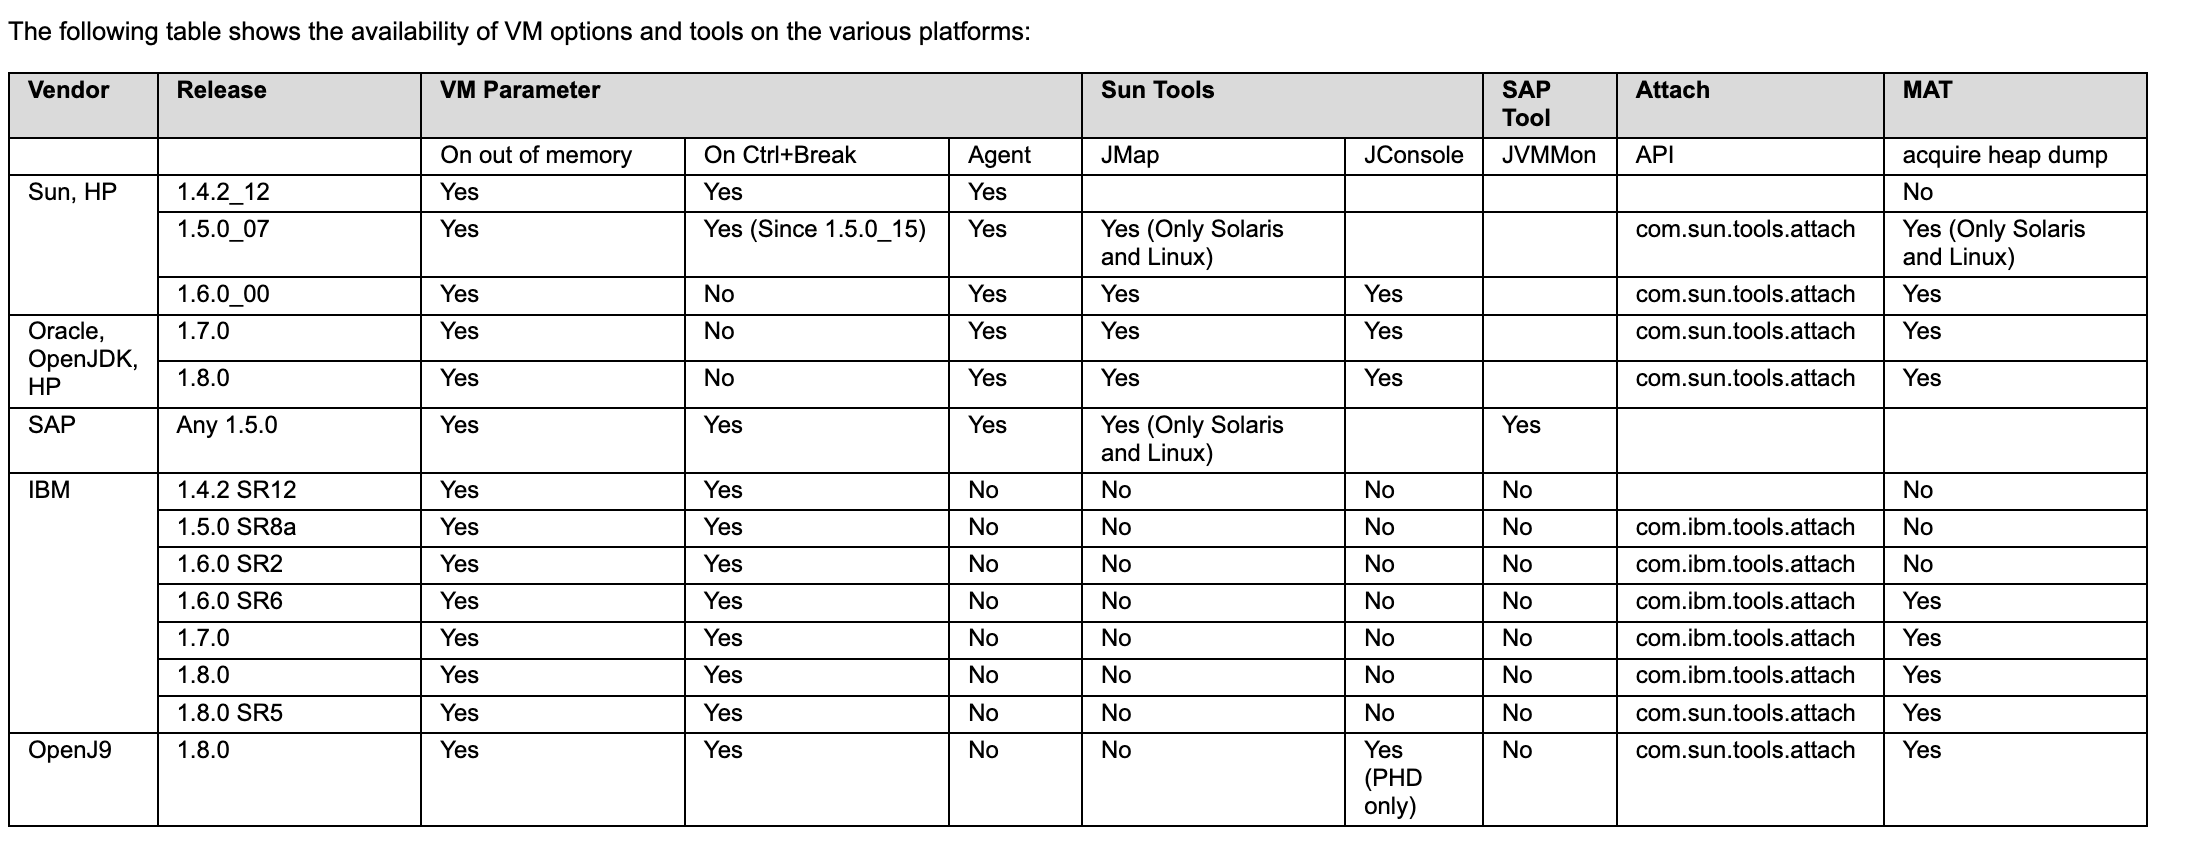
The following table shows the availability of VM options and tools on the various platforms: