QCustomplot功能很强大,可example给的不够用,
需求是:创建多个轴,每个轴可以显示多个曲线
网上搜集后整理如下:
#include "widget.h"
#include "ui_widget.h"

Widget::Widget(QWidget *parent)
    : QWidget(parent)
    , ui(new Ui::Widget)
{
    ui->setupUi(this);
    m_pCPlot = new QCustomPlot(this);
    m_pCPlot->plotLayout()->clear();

    m_pCPlot->setInteractions(QCP::iRangeDrag | QCP::iRangeZoom | QCP::iSelectPlottables);

    QCPAxisRect *axisRect1 = new QCPAxisRect(m_pCPlot);
    //axisRect1->setupFullAxesBox(true);
    axisRect1->addAxis(QCPAxis::atLeft)->setTickLabelColor(QColor("#6050F8"));
    m_pCPlot->plotLayout()->addElement(0,0,axisRect1);


    QCPAxisRect *axisRect2 = new QCPAxisRect(m_pCPlot);
    //axisRect2->setupFullAxesBox(true);
    axisRect2->addAxis(QCPAxis::atLeft)->setTickLabelColor(QColor("#1050F8"));
    m_pCPlot->plotLayout()->addElement(1,0,axisRect2);


    QVector<double> x(101),y0(101),y1(101),y2(101),y3(101);
    for(int i=0;i<101;i++)
    {
        x[i] = i/50.0-1;
        y0[i]= qExp(-x[i]*x[i]*2)+2;
        y1[i]=qSin(x[i]*3);
        y2[i]=qCos(x[i]*3);
        y3[i]=qTan(x[i]*3);
    }

    QCPGraph *graph0 = m_pCPlot->addGraph(axisRect1->axis(QCPAxis::atBottom),axisRect1->axis(QCPAxis::atLeft));
    graph0->setData(x,y0);
    graph0->setPen(QPen(Qt::blue));
    graph0->rescaleAxes();

    QCPGraph *graph1 = m_pCPlot->addGraph(axisRect1->axis(QCPAxis::atBottom),axisRect1->axis(QCPAxis::atLeft));
    graph1->setData(x,y1);
    graph1->setPen(QPen(Qt::red));
    graph1->rescaleAxes();


    QCPGraph *graph2 = m_pCPlot->addGraph(axisRect2->axis(QCPAxis::atBottom),axisRect2->axis(QCPAxis::atLeft));
    graph2->setData(x,y1);
    graph2->setPen(QPen(Qt::green));
    graph2->rescaleAxes();

    QCPGraph *graph3 = m_pCPlot->addGraph(axisRect2->axis(QCPAxis::atBottom),axisRect2->axis(QCPAxis::atLeft));
    graph3->setData(x,y2);
    graph3->setPen(QPen(Qt::black));
    graph2->rescaleAxes();

    // make axis rects' left side line up:
    QCPMarginGroup *group = new QCPMarginGroup(m_pCPlot);
    //m_pCPlot->axisRect()->setMarginGroup(QCP::msLeft|QCP::msRight, group);
    //wideAxisRect->setMarginGroup(QCP::msLeft|QCP::msRight, group);
    for(int j=0;j<m_pCPlot->axisRectCount();j++)
    {
        m_pCPlot->axisRect(j)->setMarginGroup(QCP::msLeft|QCP::msRight, group);
    }

    QSplitter *mainSplitter = new QSplitter(Qt::Vertical,this);
    mainSplitter->addWidget(m_pCPlot);

    QVBoxLayout *vLayout = new QVBoxLayout(this);
    vLayout->addWidget(mainSplitter);

    m_pCPlot->replot();


}
其它参考:
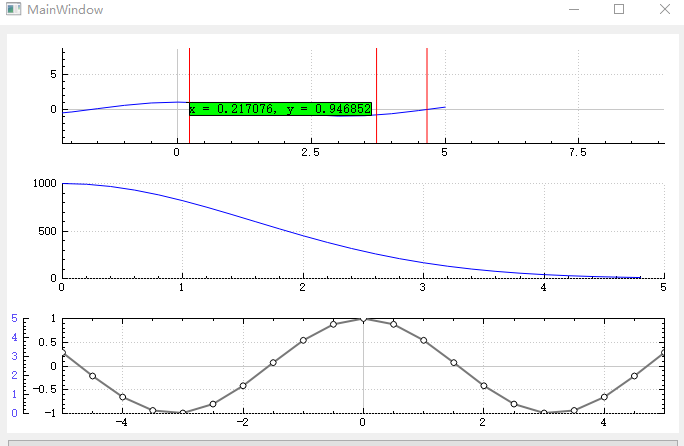
关于QCustomplot多坐标轴的QCPItemTracer的游标问题!
MainWindow::MainWindow(QWidget *parent)

    : QMainWindow(parent)

    , ui(new Ui::MainWindow)

{

    ui->setupUi(this);

    test();

    for ( int i = 0; i < 3; i++) {

        tracer[i] = new QCPItemTracer(ui->customPlot);

        tracer[i]->setPen(QPen(Qt::DashLine));

        tracer[i]->setStyle(QCPItemTracer::tsPlus);//游标样式:十字星、圆圈、方框等


        tracerLabel[i] = new QCPItemText(ui->customPlot); //生成游标说明

        //下面的代码就是设置游标说明的外观和对齐方式等状态

        tracerLabel[i]->setLayer("overlay");

        tracerLabel[i]->position->setCoords(0.5, 0);

        tracerLabel[i]->setFont(QFont(font().family(), 10));

        tracerLabel[i]->setPen(QPen(Qt::black));

        tracerLabel[i]->setPositionAlignment(Qt::AlignLeft | Qt::AlignTop);

        tracerLabel[i]->setBrush(Qt::green);

        //下面这个语句很重要,它将游标说明锚固在tracer位置处,实现自动跟随

        tracerLabel[i]->position->setParentAnchor(tracer[i]->position);


        m_lineV[i] = new QCPItemStraightLine(ui->customPlot);

        QPen linesPen(Qt::red, 1, Qt::SolidLine);

        m_lineV[i]->setLayer("overlay");

        m_lineV[i]->setPen(linesPen);

        m_lineV[i]->setClipToAxisRect(true);

        m_lineV[i]->point1->setCoords(0, 0);

        m_lineV[i]->point2->setCoords(0, 0);

    }

    connect(ui->customPlot, &QCustomPlot::mouseMove, this, &MainWindow::myMoveEvent);

}


MainWindow::~MainWindow()

{

    delete ui;

}


void MainWindow::myMoveEvent(QMouseEvent *event)

{

            double xValue;

            double yValue;


            qDebug() << "aaaa";

            double yy = wideAxisRect->axis(QCPAxis::atBottom)->pixelToCoord(event->pos().x());

            m_lineV[0]->point1->setCoords(yy, 1);

            m_lineV[0]->point2->setCoords(yy, 0);

                tracer[0]->setGraph(mainGraphCos);//将游标和该曲线图层想连接

                tracer[0]->position->setAxes(wideAxisRect->axis(QCPAxis::atBottom), wideAxisRect->axis(QCPAxis::atLeft));

                tracer[0]->setGraphKey(yy); //将游标横坐标(key)设置成刚获得的横坐标数据

                tracer[0]->setInterpolating(true); //游标的纵坐标可以通过曲线数据线性插值自动获得(这就不用手动去计算了)

                tracer[0]->updatePosition(); //使得刚设置游标的横纵坐标位置生效

                //以下代码用于更新游标说明的内容

                xValue = tracer[0]->position->key();

                yValue = tracer[0]->position->value();

                //设置游标说明(tracerLabel)的内容

                tracerLabel[0]->setText(QString("x = %1, y = %2").arg(xValue).arg(yValue));


            double xx = subRectLeft->axis(QCPAxis::atBottom)->pixelToCoord(event->pos().x());

            m_lineV[1]->point1->setCoords(xx, 1);

            m_lineV[1]->point2->setCoords(xx, 0);

            tracer[1]->setGraph(subGraphRandom);//将游标和该曲线图层想连接

            tracer[1]->position->setAxes(subRectLeft->axis(QCPAxis::atBottom), subRectLeft->axis(QCPAxis::atLeft));

            tracer[1]->setGraphKey(xx); //将游标横坐标(key)设置成刚获得的横坐标数据x

            tracer[1]->setInterpolating(true); //游标的纵坐标可以通过曲线数据线性插值自动获得(这就不用手动去计算了)

            tracer[1]->updatePosition(); //使得刚设置游标的横纵坐标位置生效

            //以下代码用于更新游标说明的内容

            xValue = tracer[1]->position->key();

            yValue = tracer[1]->position->value();

            //设置游标说明(tracerLabel)的内容

            tracerLabel[1]->setText(QString("x = %1, y = %2").arg(xValue).arg(yValue));


            double x = subRectRight->axis(QCPAxis::atBottom)->pixelToCoord(event->pos().x());

            m_lineV[2]->point1->setCoords(x, 1);

            m_lineV[2]->point2->setCoords(x, 0);

            tracer[2]->setGraph(subBars);//将游标和该曲线图层想连接

            tracer[2]->position->setAxes(subRectRight->axis(QCPAxis::atBottom), subRectRight->axis(QCPAxis::atLeft));

            tracer[2]->setGraphKey(x); //将游标横坐标(key)设置成刚获得的横坐标数据x

            tracer[2]->setInterpolating(true); //游标的纵坐标可以通过曲线数据线性插值自动获得(这就不用手动去计算了)

            tracer[2]->updatePosition(); //使得刚设置游标的横纵坐标位置生效

            //以下代码用于更新游标说明的内容

            xValue = tracer[2]->position->key();

            yValue = tracer[2]->position->value();

            //设置游标说明(tracerLabel)的内容

            tracerLabel[2]->setText(QString("x = %1, y = %2").arg(xValue).arg(yValue));


            ui->customPlot->replot();

}


void MainWindow::test()

{

    ui->customPlot->plotLayout()->clear();   // 首先清空默认的轴矩形,让我们从头开始


    ui->customPlot->setInteractions(QCP::iRangeDrag | QCP::iRangeZoom | QCP::iSelectPlottables | QCP::iSelectLegend);

    wideAxisRect = new QCPAxisRect(ui->customPlot);   // 还记得setupDefaultAxes为true时的作用吗,忘了的话翻上去看吧

    wideAxisRect->setupFullAxesBox(true);    // 让四个轴关联,并全部显示出来

    wideAxisRect->addAxis(QCPAxis::atLeft)->setTickLabelColor(QColor("#6050F8"));  // 在左边多添加一个轴并且设置它的颜色


    ui->customPlot->plotLayout()->addElement(2, 0, wideAxisRect);     // 在第一行添加轴矩形       // 在第二行添加一个子布局,后面会添加两个轴矩形在里面


    subRectLeft = new QCPAxisRect(ui->customPlot);   // 不配置轴

    subRectRight = new QCPAxisRect(ui->customPlot);


    ui->customPlot->plotLayout()->addElement(0, 0, subRectLeft);                      // 在第一列添加轴矩形

    ui->customPlot->plotLayout()->addElement(1, 0, subRectRight);                     // 在第二列添加轴矩形


    subRectLeft->axis(QCPAxis::atLeft)->ticker()->setTickCount(2); // 设置轴的刻度为一个固定的步进值

    subRectRight->axis(QCPAxis::atLeft)->ticker()->setTickCount(2);


    // 准备数据

    QVector<QCPGraphData> dataCos(21), dataGauss(50), dataRandom(100);

    QVector<double> x3, y3;

    qsrand(3);

    for (int i=0; i<dataCos.size(); ++i) {

        dataCos[i].key = i/(double)(dataCos.size()-1)*10-5.0;

        dataCos[i].value = qCos(dataCos[i].key);

    }

    for (int i=0; i<dataGauss.size(); ++i) {

        dataGauss[i].key = i/(double)dataGauss.size()*10-5.0;

        dataGauss[i].value = qExp(-dataGauss[i].key*dataGauss[i].key*0.2)*1000;

    }

    for (int i=0; i<dataRandom.size(); ++i) {

        dataRandom[i].key = i/(double)dataRandom.size()*10;

        dataRandom[i].value = qrand()/(double)RAND_MAX-0.5+dataRandom[qMax(0, i-1)].value;

    }

    x3 << 1 << 2 << 3 << 4;

    y3 << 2 << 2.5 << 4 << 1.5;


    // mainGraphCos和 mainGraphGauss 共享下轴,但是它们的左轴不同

    mainGraphCos = ui->customPlot->addGraph(wideAxisRect->axis(QCPAxis::atBottom), wideAxisRect->axis(QCPAxis::atLeft));

    mainGraphCos->data()->set(dataCos);

    mainGraphCos->valueAxis()->setRange(-1, 1);

    mainGraphCos->rescaleKeyAxis();

    mainGraphCos->setScatterStyle(QCPScatterStyle(QCPScatterStyle::ssCircle, QPen(Qt::black), QBrush(Qt::white), 6));

    mainGraphCos->setPen(QPen(QColor(120, 120, 120), 2));


    subGraphRandom = ui->customPlot->addGraph(subRectLeft->axis(QCPAxis::atBottom), subRectLeft->axis(QCPAxis::atLeft));

    subGraphRandom->data()->set(dataCos);

    subGraphRandom->valueAxis()->setRange(-1,5);


    subBars = ui->customPlot->addGraph(subRectRight->axis(QCPAxis::atBottom), subRectRight->axis(QCPAxis::atLeft));

    subBars->data()->set(dataGauss);

    subBars->valueAxis()->setRange(0,1000);


    qDebug() << ui->customPlot->axisRectCount();

    qDebug() << ui->customPlot->graphCount();

    QCPMarginGroup *marginGroup = new QCPMarginGroup(ui->customPlot);


    for (int j = 0; j < ui->customPlot->axisRectCount(); j++) {

        ui->customPlot->axisRect(j)->setMarginGroup(QCP::msLeft|QCP::msRight, marginGroup);

    }

}
  QCustomPlot* customPlot = ui->customPlot_6;
    // 添加两个graph
      customPlot->addGraph();
      customPlot->graph(0)->setPen(QPen(Qt::blue)); // 第一条曲线颜色
      customPlot->graph(0)->setBrush(QBrush(QColor(0, 0, 255, 20))); // 第一条曲线和0轴围成区域填充的颜色
      customPlot->addGraph();
      customPlot->graph(1)->setPen(QPen(Qt::red)); // 第二条曲线颜色
      // 生成数据
      QVector<double> x(251), y0(251), y1(251);
      for (int i=0; i<251; ++i)
      {
        x[i] = i;
        y0[i] = qExp(-i/150.0)*qCos(i/10.0); // 指数衰减的cos
        y1[i] = qExp(-i/150.0);              // 衰减指数
      }
      // 配置右侧和顶部轴显示刻度,但不显示标签:
      customPlot->xAxis2->setVisible(true);
      customPlot->xAxis2->setTickLabels(false);
      customPlot->yAxis2->setVisible(true);
      customPlot->yAxis2->setTickLabels(false);
      // 让左边和下边轴与上边和右边同步改变范围
      connect(customPlot->xAxis, SIGNAL(rangeChanged(QCPRange)), customPlot->xAxis2, SLOT(setRange(QCPRange)));
      connect(customPlot->yAxis, SIGNAL(rangeChanged(QCPRange)), customPlot->yAxis2, SLOT(setRange(QCPRange)));
      // 设置数据点
      customPlot->graph(0)->setData(x, y0);
      customPlot->graph(1)->setData(x, y1);
      // 让范围自行缩放,使图0完全适合于可见区域:
      customPlot->graph(0)->rescaleAxes();
      // 图1也是一样自动调整范围,但只是放大范围(如果图1小于图0):
      customPlot->graph(1)->rescaleAxes(true);
      // 允许用户用鼠标拖动轴范围,用鼠标滚轮缩放,点击选择图形:
      customPlot->setInteractions(QCP::iRangeDrag | QCP::iRangeZoom | QCP::iSelectPlottables);
      customPlot->replot();
(1)上下轴,左右轴范围同步
利用rangeChanged信号传递轴范围QCPRange,范围改变时将xAxis的范围传给xAxis2,yAxis也是,就能实现轴范围同步了。
connect(customPlot->xAxis, SIGNAL(rangeChanged(QCPRange)), customPlot->xAxis2, SLOT(setRange(QCPRange)));
connect(customPlot->yAxis, SIGNAL(rangeChanged(QCPRange)), customPlot->yAxis2, SLOT(setRange(QCPRange)));
(2)自动调整范围,使数据全部可见。
调用rescaleAxes (bool onlyEnlarge = false)重新调整与此绘图表关联的键和值轴,以显示所有的数据
onlyEnlarge 默认false,表示范围可以缩小放大,如果为true表示只能放大,而不会缩小范围。
例如曲线:
调用 customPlot->graph(0)->rescaleAxes();后范围被缩小了,曲线正好占满整个区域,但是调用customPlot->graph(0)->rescaleAxes(true)就不会有变化,因为区域不会缩小。
利用这点可以通过多次调用rescaleaxis来完整地显示多个graph的数据。让graph(0)自动缩放rescaleAxes(),在graph(0)范围的基础上rescaleAxes(true)只会扩大范围或不变而不缩小,这样最终能够显示graph(n)所有的数据