Understanding q-value and FDR in Differential Expression Analysis
Daqian
Introduction to q-value and FDR
In differential gene expression analysis, researchers are often confronted with the challenge of distinguishing true signals — those genes that are genuinely differentially expressed, from the noise — genes that appear to be differentially expressed due to random chance. The p-value is a commonly used statistic to address this issue, but when dealing with thousands of genes, the false discovery rate (FDR) becomes critically important. The q-value is an adjusted p-value that controls for the FDR, and it’s particularly useful in large-scale testing scenarios, such as genomic studies.
The hedenfalk dataset
The hedenfalk dataset includes results from an analysis of gene expression related to BRCA1 and BRCA2 mutations in breast cancer patients. It contains p-values, test statistics, and empirical null statistics for 3170 genes.
Let’s load the dataset and inspect its structure:
library(qvalue)## Warning: package 'qvalue' was built under R version 4.3.1data(hedenfalk)
class(hedenfalk)## [1] "list"names(hedenfalk)## [1] "p" "stat" "stat0"We can extract the p-values and observe the statistics as follows:
pvalues = hedenfalk$p
obs_stats = hedenfalk$stat
null_stats = hedenfalk$stat0

length(obs_stats)
## [1] 3170length(null_stats)## [1] 317000Calculating q-values
Using the qvalue package, we can calculate q-values for each p-value:
qobj = qvalue(p = pvalues)

class(qobj)
## [1] "qvalue"names(qobj)## [1] "call" "pi0" "qvalues" "pvalues" "lfdr"
## [6] "pi0.lambda" "lambda" "pi0.smooth"qvalues = qobj$qvalues
pi0 = qobj$pi0
lfdr = qobj$lfdrA quick summary and visualization can be provided by:
summary(qobj)##
## Call:
## qvalue(p = pvalues)
##
## pi0: 0.669926
##
## Cumulative number of significant calls:
##
## <1e-04 <0.001 <0.01 <0.025 <0.05 <0.1 <1
## p-value 15 76 265 424 605 868 3170
## q-value 0 0 1 73 162 319 3170
## local FDR 0 0 3 30 85 167 2241hist(qobj)
plot(qobj)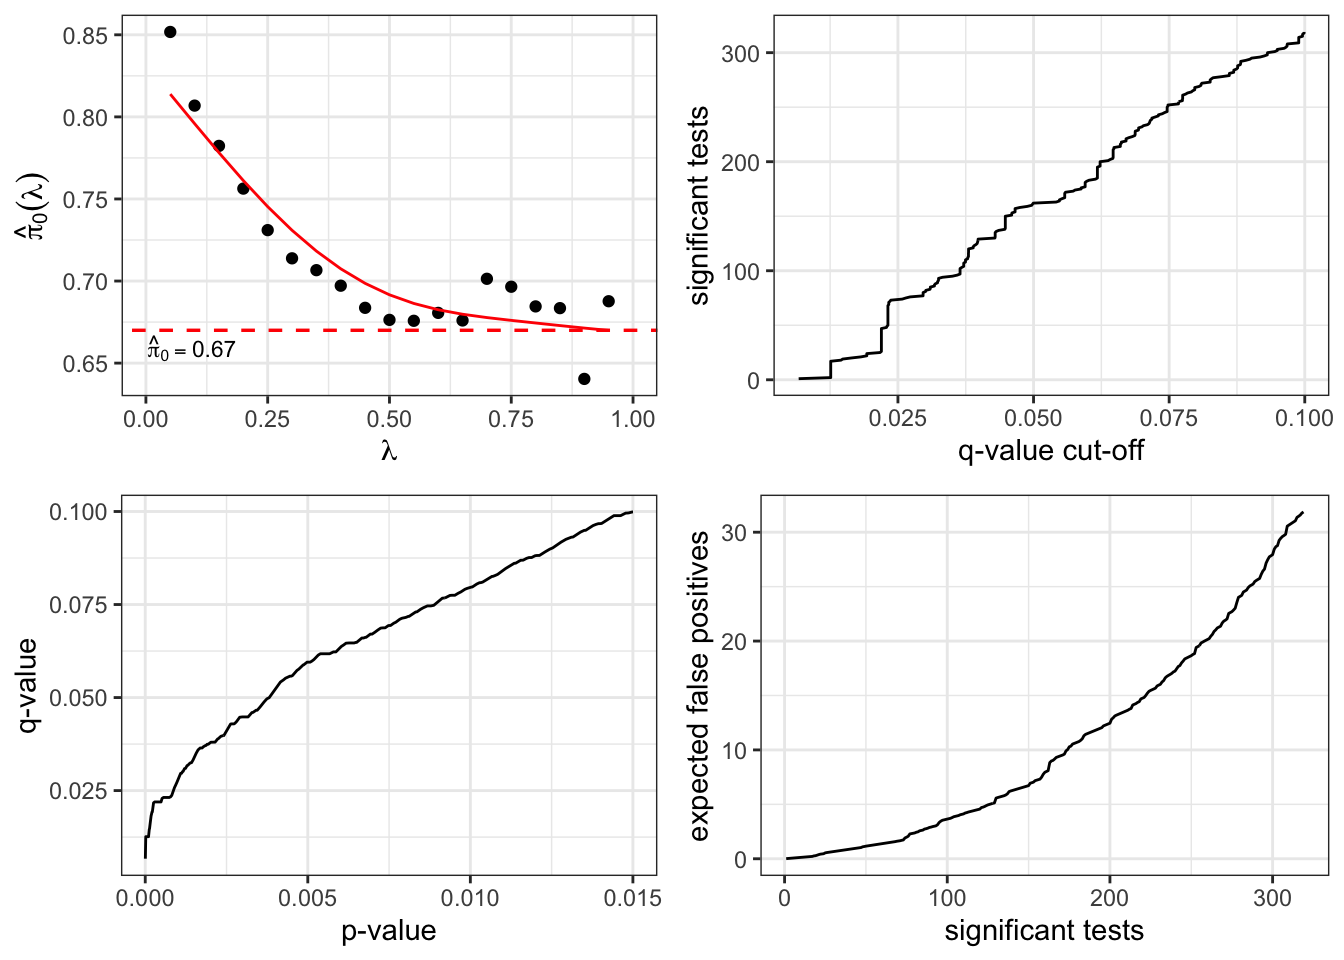
Interpreting q-values and FDR
When we execute the command max(qvalues[qobj$pvalues <= 0.01]), we find the highest q-value among all p-values less than or equal to 0.01. Suppose this q-value is 0.07932; it implies that we estimate about 7.932% of the genes identified as differentially expressed (p-value <= 0.01) are false positives. In other words, we have an FDR of 0.07932.
Conversely, running max(pvalues[qobj$qvalues <= 0.01]) gives us the highest p-value that corresponds to a controlled q-value of less than or equal to 0.01. Let’s say this p-value is 3.15e-06. This means, for all genes with a p-value <= 3.15e-06, their FDR does not exceed 1%.
Using a specific FDR level
When we run the qvalue function with an fdr.level = 0.01, we get:
qobj_fdrlevel = qvalue(p = hedenfalk$p, fdr.level = 0.01)
head(qobj_fdrlevel$significant); length(qobj_fdrlevel$significant)
## [1] FALSE FALSE FALSE FALSE FALSE FALSE## [1] 3170This command also yields a logical vector significant, which indicates which genes meet the FDR threshold of 0.01. To get the indices of these genes, we can use:
significant_genes = which(qobj_fdrlevel$significant)
head(significant_genes)
## [1] 1413Conclusion
The q-value is a powerful tool for researchers performing large-scale hypothesis testing, as it provides a means to control the false discovery rate. By utilizing the qvalue package in R, we can confidently identify genes that are truly differentially expressed, while minimizing the rate of false positives. This is crucial in fields like genomics, where the sheer number of simultaneous tests can lead to a high number of false discoveries if not properly controlled.
- Understanding Differential Expression Analysis q-valueunderstanding differential expression analysis differential equations nonlinear analysis q-value differential differential algorithms variables deciding collaboration differential learning machine inconsistencies vulnerabilities differential differential detremine center system differential constraint frequency-based randomization differential guaranteeing